

by Katie Paige, on September 13, 2016

Time flies when you're having fun - we can't believe Tableau 10 has been out for nearly a month! We've been having so much fun that we decided to round …
Read Storyby Katie Paige, on September 1, 2016
Tab-WHAT? Along your Tableau journey, you might have come across some confusing acronyms that Tableau uses. Here's a quick cheat sheet: Tableau Workbook File (TWB): An XML document which contains …
Read Storyby Katie Paige, on August 30, 2016

Forbes recently did a rundown of the top 100 analytics startups around the world. Based on an analysis of Crunchbase data, they found that 2,655 startups were listed - and …
Read Storyby Kayle Simpson, on August 25, 2016
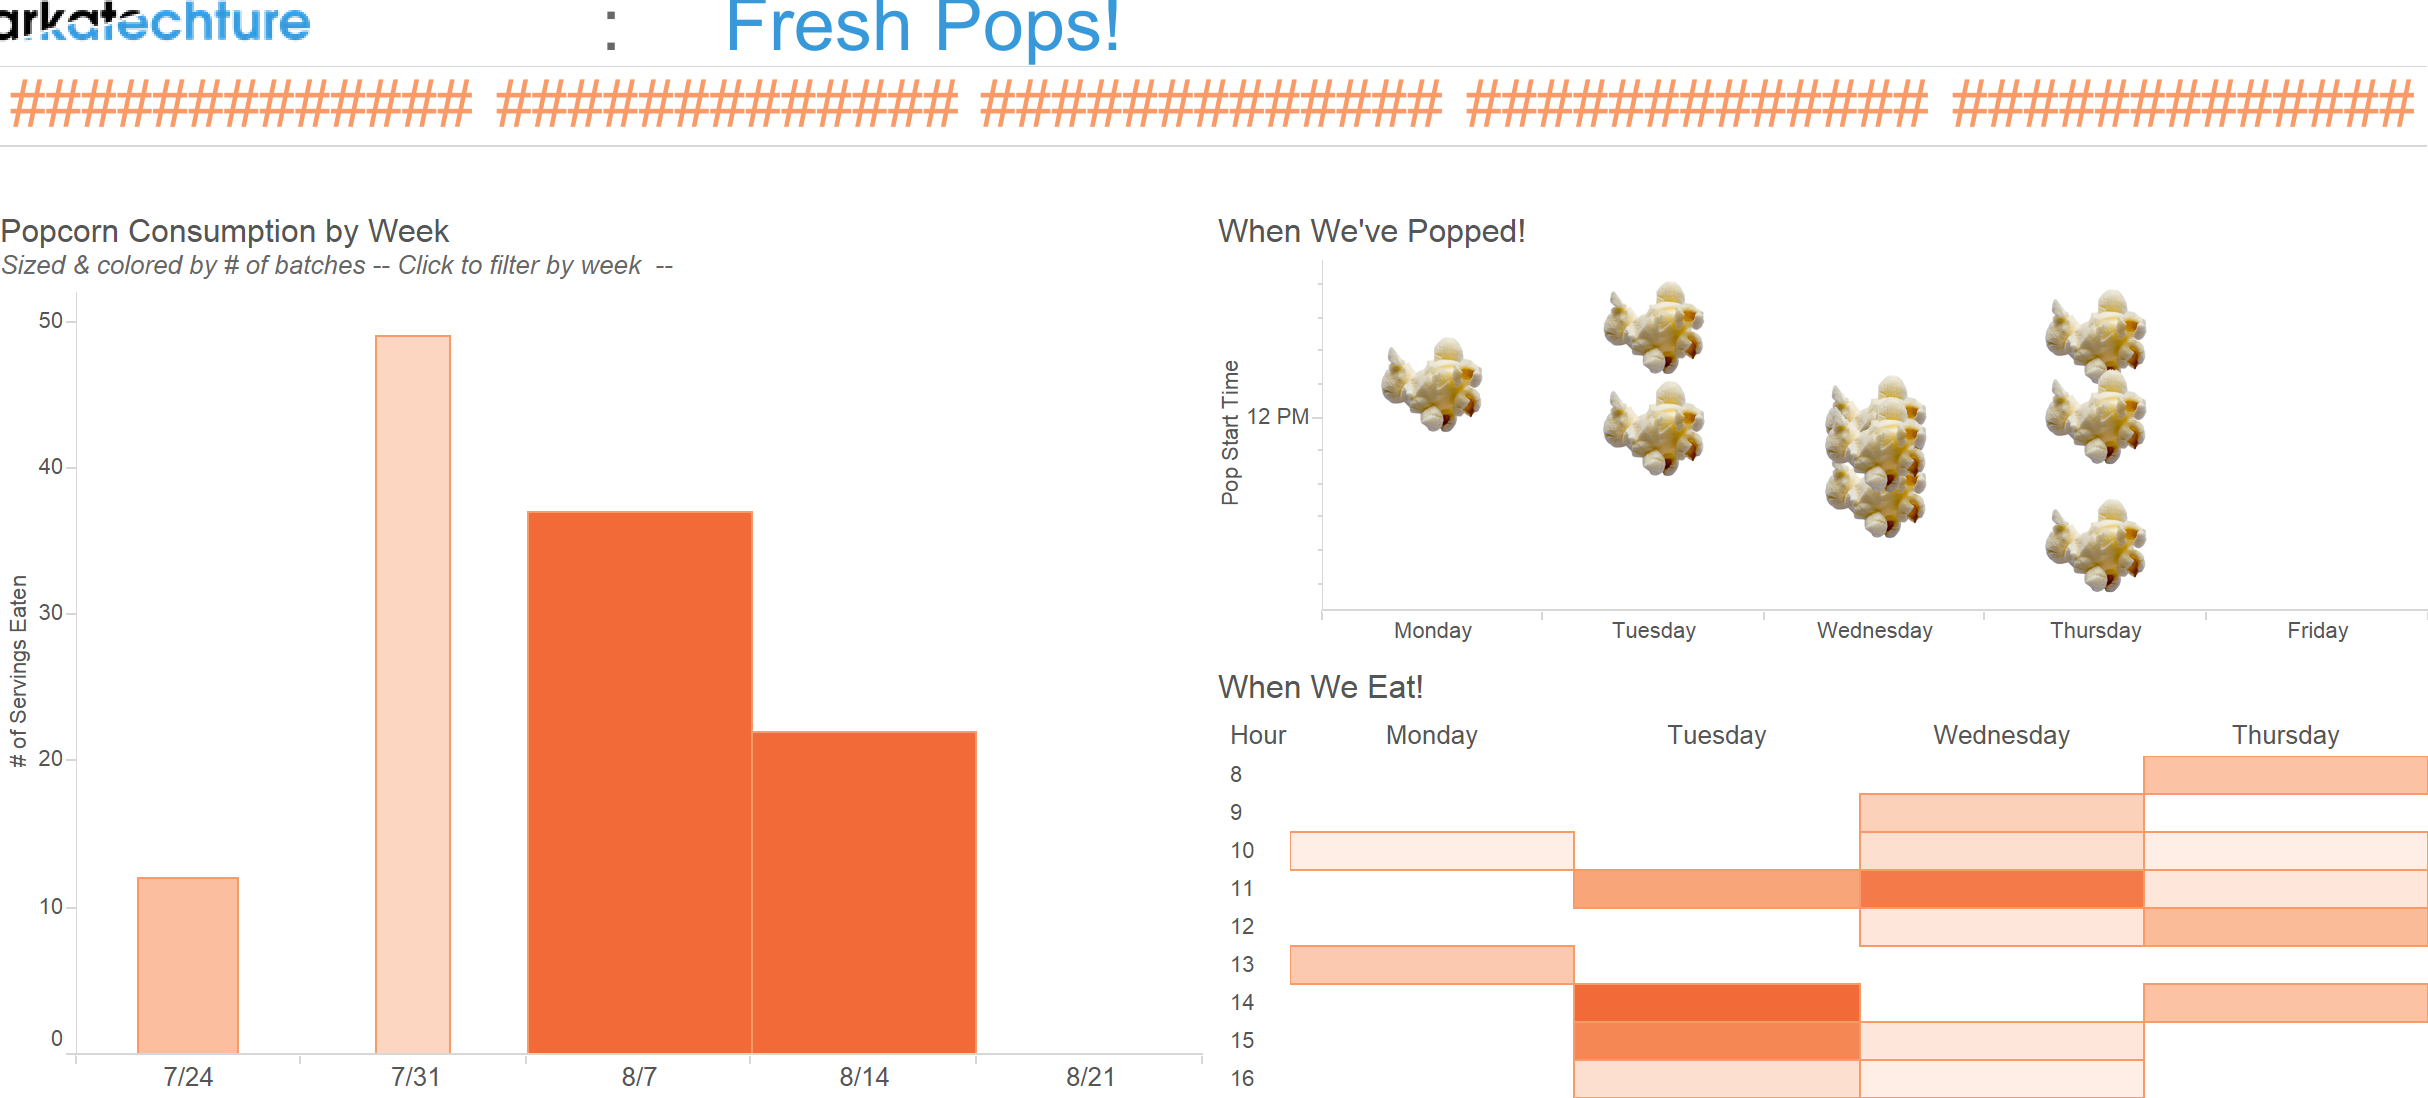
We've already outlined how we connected a Raspberry Pi to our Popcorn Maker, and how we automated our Slack messages to tell us when "Fresh Pops" are made - so …
Read Storyby Katie Paige, on August 11, 2016
In our last Tableau 101 blog post, we looked at how to figure out which Tableau product is right for you. By now, hopefully you've picked your version of Tableau, …
Read Story75 Washington Ave., Suite 2D
Portland, ME 04101

