
Deploy 20+ dashboards and reports out-of-the-box to supercharge your data analytics and business intelligence adoption.
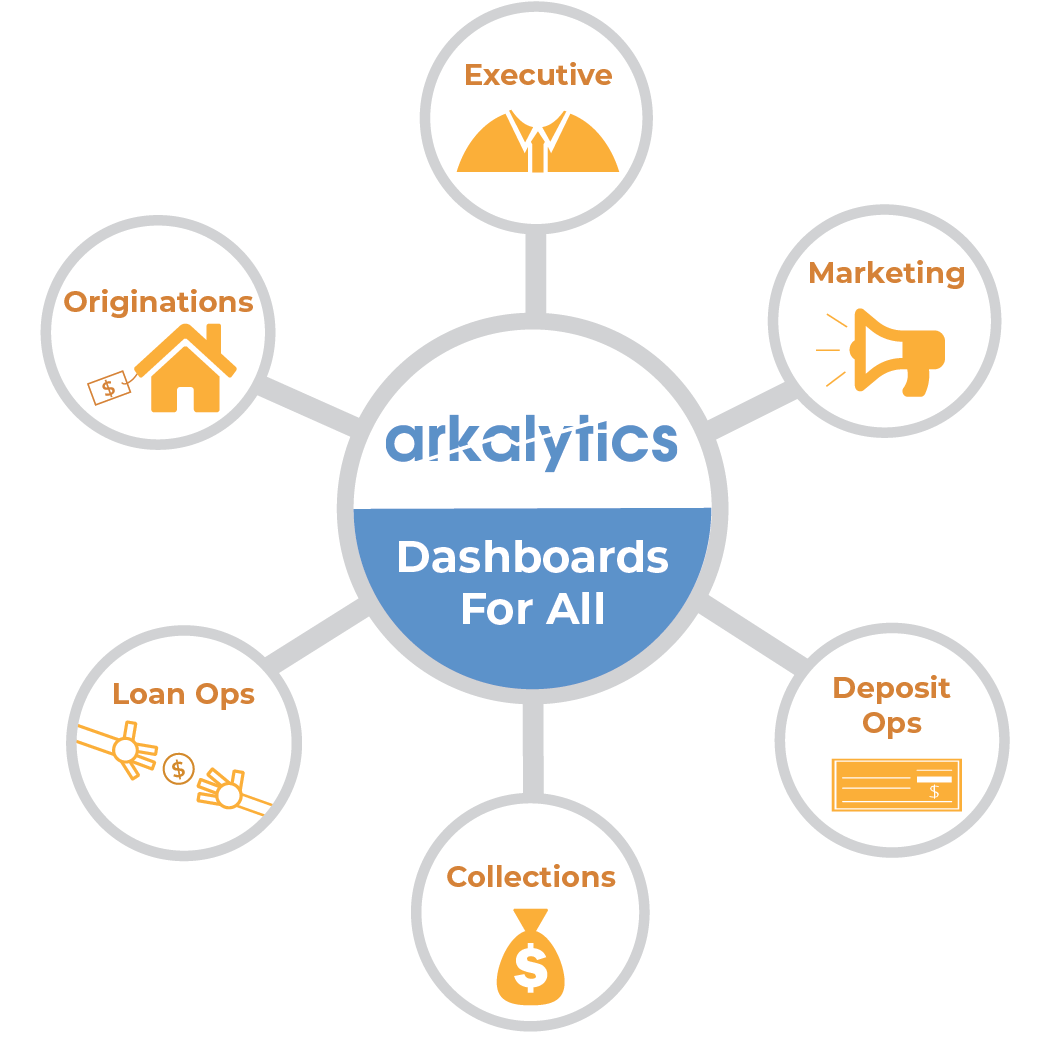
From marketing, to originations and loan operations - we've built a dashboard for that.
Track key performance indicators and manage thresholds with data-driven alerts. Embed your business logic within each data visualization.
Each dashboard is crafted from user stories and workflows to capture operational efficiencies and strategic insights.
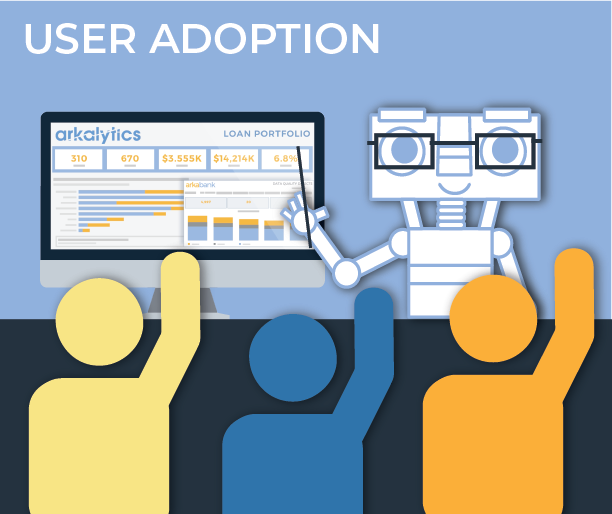
Use visualizations like the User Adoption Dashboard to track utilization and frequently used dashboards. This type of analysis helps answer questions like:
Partner with Arkatechture to boost adoption through optional training classes on Structured Query Language (SQL) and BI tools like Power BI and Tableau to get hands-on experience using your data!
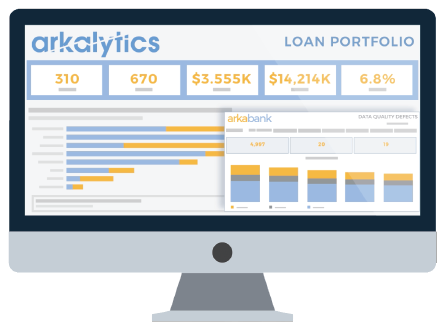
With Arkatechture's Reporting & Dashboard solution, you'll receive the following benefits and features in addition to the 20+ Dashboards & Reports:
Connect with a data expert to see if our Dashboards solution is a good fit for your organization. Take the next step along your data analytics journey to see a demo, request pricing, or ask us a question.