Visualize your data, discover insights, and drive strategic growth with Power BI.
Uncover meaningful insights and tell impactful stories with data using interactive Power BI dashboards.
Ready to visualize your data with Power BI? Book a free consultation with our expert analysts to implement, train, support, or develop within your Power BI environment.


Download our Power BI dashboards guide for credit unions. Learn how to visualize key trends in member behavior, lending, and deposits all from a single, trusted data source.

Get more out of Power BI by connecting to a curated data source for organization-wide access to accurate, trusted insights. We specialize in member analytics, loan performance, and operational reporting to help teams like lending and marketing identify trends, improve performance, and turn data into a strategic asset.
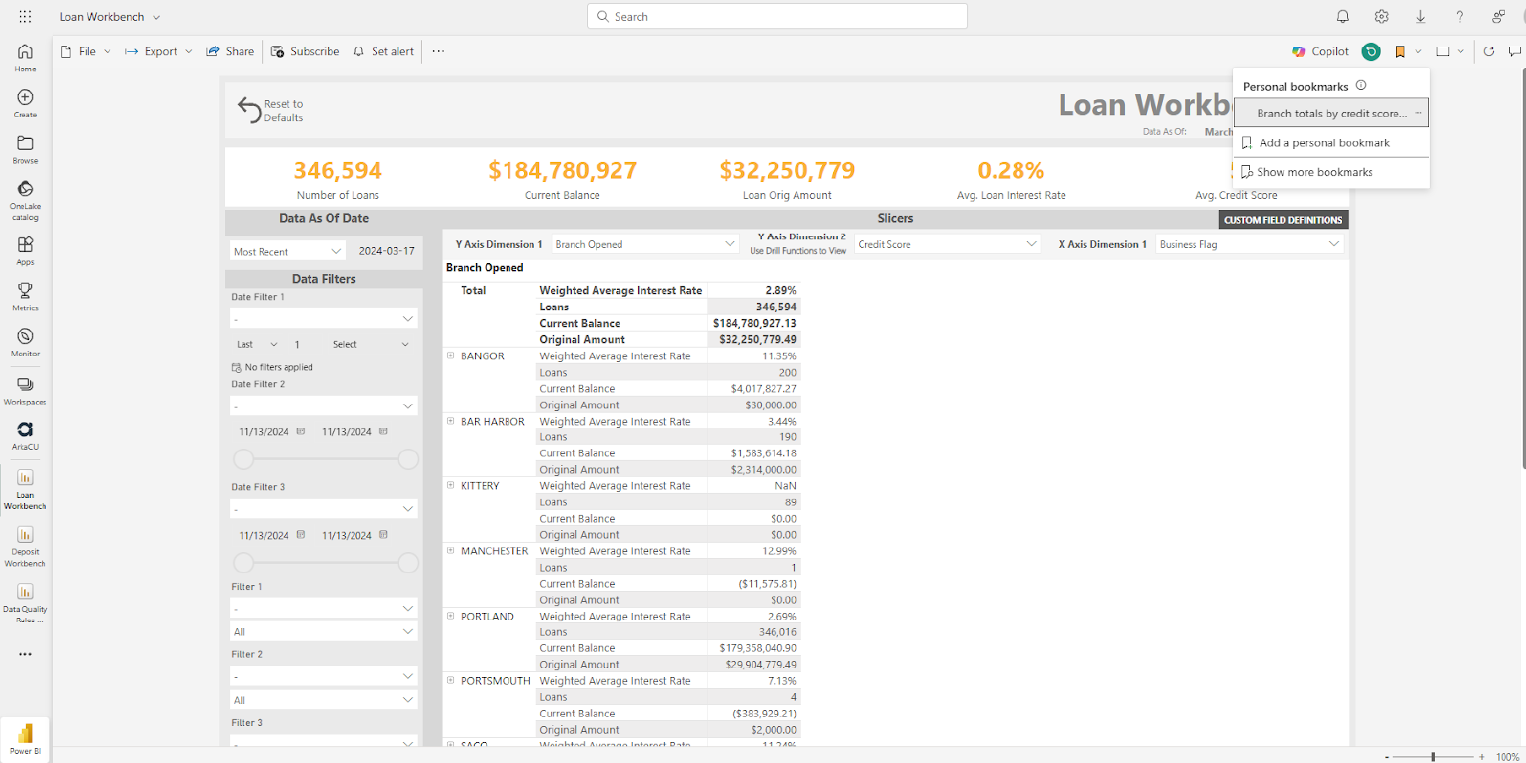
Empower teams to explore loan data, analyze past-due trends, and break down portfolios by rate, term, balance, and more - no analyst needed!
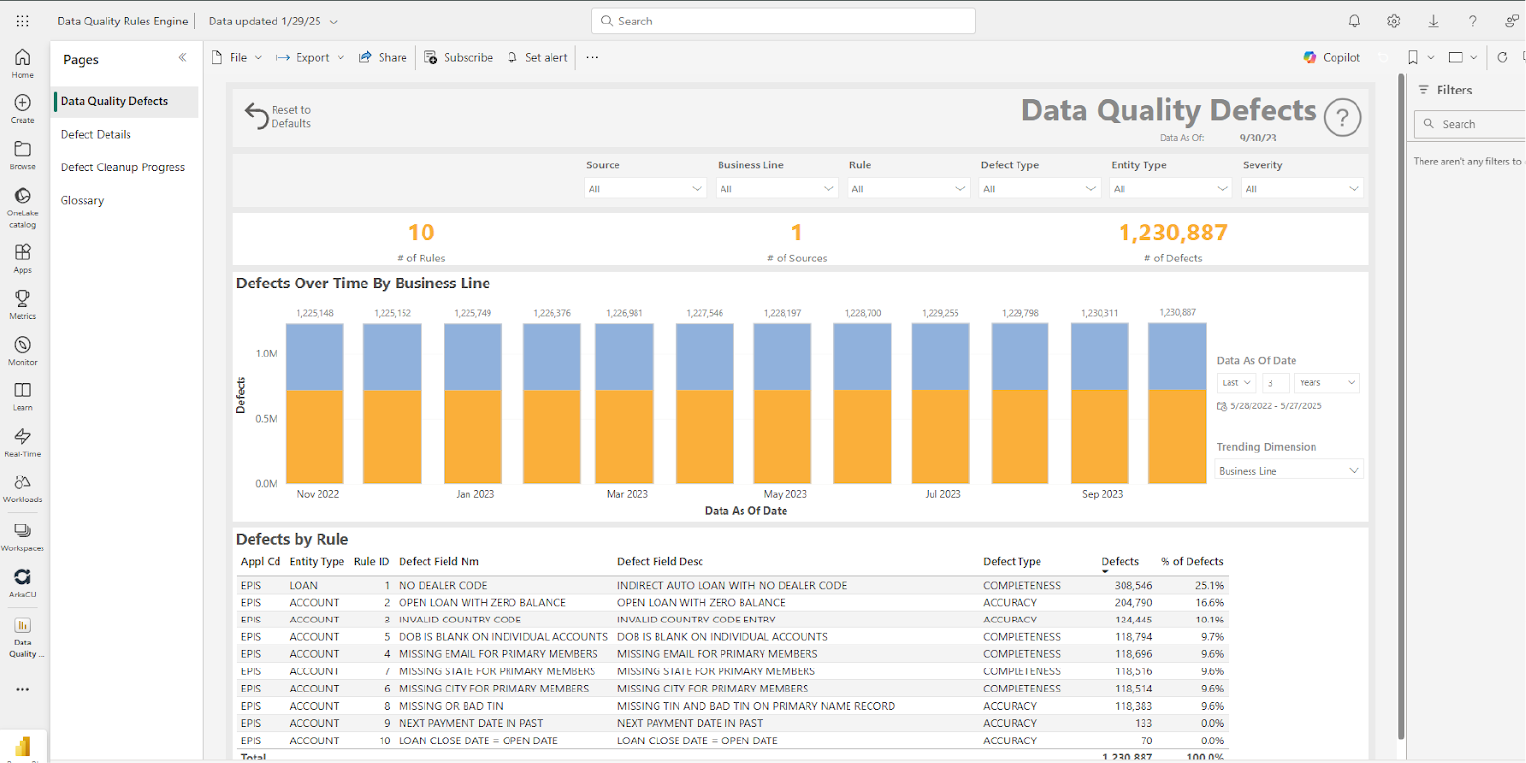
Spot and resolve data defects fast. Track cleanup progress across teams, like one Credit Union that fixed 500K issues during their core conversion project.
Build and tailor dashboards with Power BI to fit your needs. Track what matters most, share insights easily, and make smarter, faster decisions.
At Arkatechture, our certified Power BI experts provide end-to-end consulting services, ensuring your organization effectively leverages Power BI to achieve its analytical goals. We partner with you to understand your unique business needs and design solutions that deliver clear, measurable results.

Embrace an accessible, powerful, and integrated approach to business intelligence with Power BI.
Power BI makes data analysis easy and accessible for all users with its intuitive interface, Microsoft integrations, and familiarity.
Connect Power BI to your data warehouse or nearly any data source, unifying everything from Excel to Salesforce into one view.
Create interactive dashboards that let users drill down, filter, and explore data through dynamic, visual storytelling.
Scale from individual users to enterprise-wide deployments, handling large datasets and complex reports efficiently.
Leverage existing licenses across your Microsoft suite or explore flexible licensing options for businesses of all sizes.
Use built-in AI tools like Q&A and Quick Insights to uncover trends and support smarter, forward-looking decisions.
Microsoft Power BI is a comprehensive business intelligence platform composed of software services, apps, and connectors that work together to turn your unrelated sources of data into coherent, visually immersive, and interactive insights.
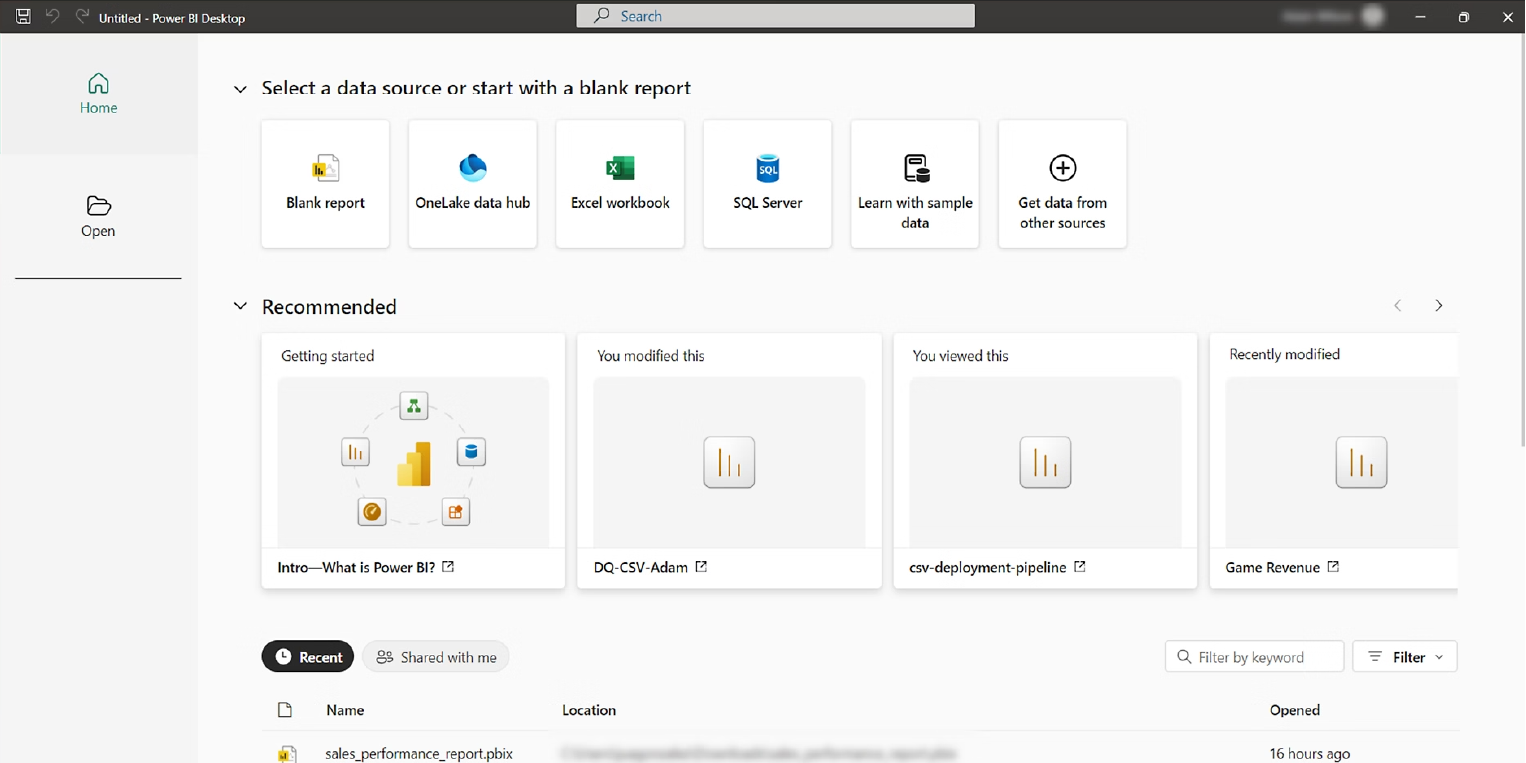
A free desktop application for Windows where users connect to data, transform and model it, and create reports.
The cloud-based platform for publishing, sharing, collaborating on, and consuming reports and dashboards through a web browser.
Provides access to reports and dashboards on iOS, Android, and Windows mobile devices for insights on the go.
Facilitate secure, live connections to on-premises data sources without moving the data to the cloud.
A data connection and transformation tool used within Power BI Desktop to extract, transform, and load (ETL) data.
A powerful formula language used to create custom calculations, measures, and computed columns in Power BI data models.
Connects to hundreds of data sources, including databases, spreadsheets, cloud services, and custom applications.
Offers a wide array of charts, graphs, maps, and custom visuals to present data in an engaging and easy-to-understand format.
We promise we won't spam your inbox with unnecessary emails. Privacy Policy


