Forbes recently did a rundown of the top 100 analytics startups around the world. Based on an analysis of Crunchbase data, they found that 2,655 startups were listed - and of those, 443 startups have been acquired, 78 have closed, 45 have exited via IPO, and 2,089 are actively operating. Forbes defines a startup as having 3 or fewer rounds of funding, which left 1,754 companies. You can read the original article here.
As a data visualization analyst at Arkatechture, what struck me the most about the article wasn't so much the content of the article, but the presentation of that content - a cross tab! While cross tabs can be useful for reporting or reading line by line detail, it's hard to quickly analyze a cross tab. This is where data visualizations come in to play - data visualizations can help quickly spot patterns and trends.
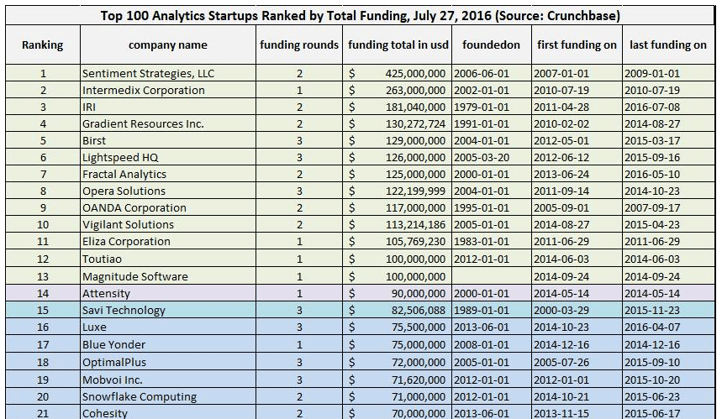
Here's Forbes' crosstab of the data:
I thought this data set deserved better! Without further ado, I present my #VizMakeover!