10 Things We Like About Tableau 10
by Katie Paige, on September 13, 2016
Time flies when you're having fun - we can't believe Tableau 10 has been out for nearly a month! We've been having so much fun that we decided to round up our top 10 favorite features and resources about Tableau's latest release:

-
Custom Regions
Gone are the days of Tableau's restricted default geographical regions! Go ahead and lasso some countries together - they will automatically become a group! These groups can be used anywhere in your workbook for additional analysis.
-
Google Sheets Connector
This may be our most used new feature yet! The native integration with Google Sheets makes connecting and refreshing so much easier. The Google Sheets + Tableau Public refresh =
 . We love that you can quickly refresh your workbook on Tableau Public when using a Google Sheets extract!
 -
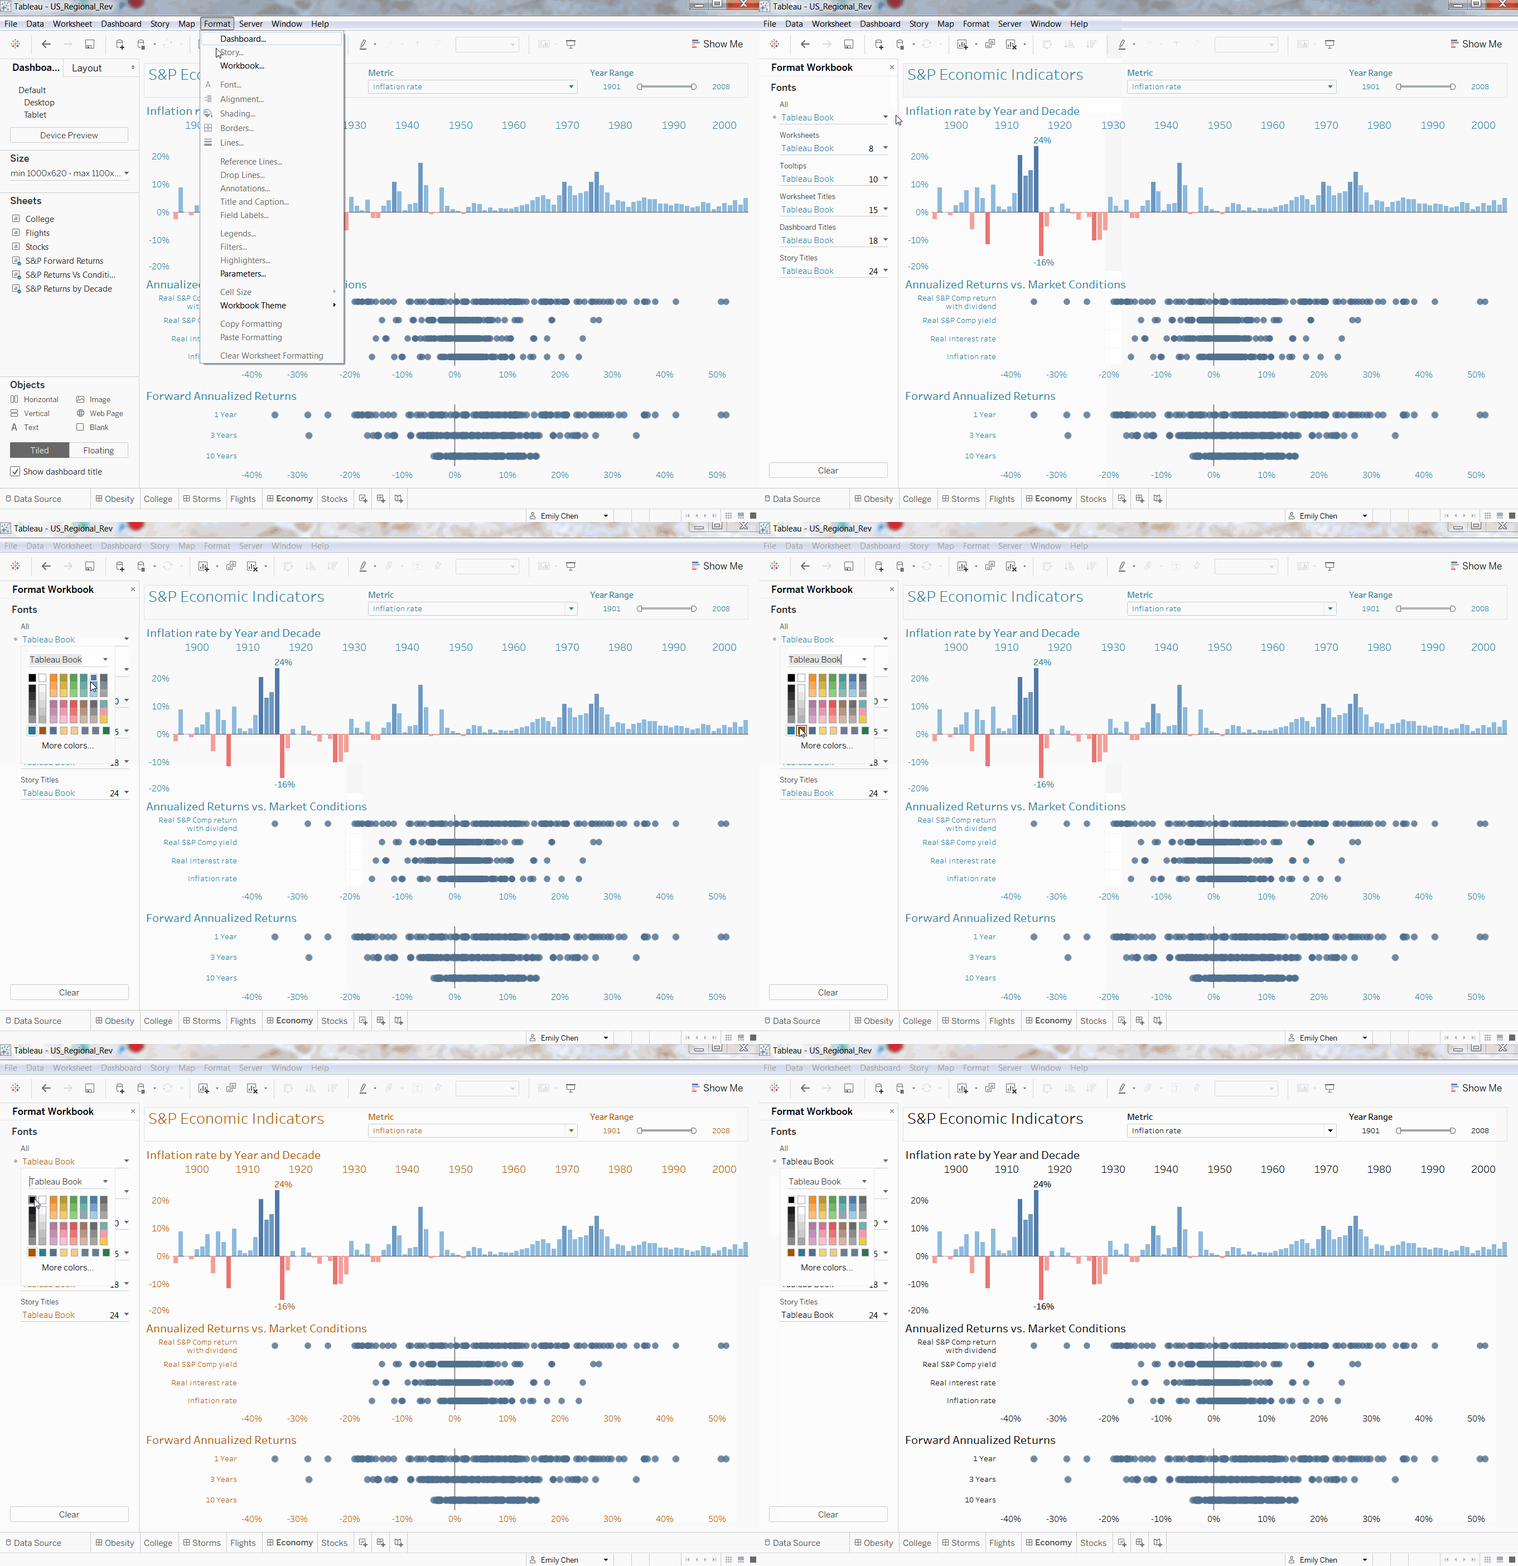
Workbook-Wide Formatting
This is a HUGE time saver! Instead of updating each sheet in your workbook, you can now update all fonts across the entire workbook with just a few clicks. (Image from Tableau)

-
Cross Database Joins and Filters
While blending was a great middle-ground while working up to cross database joins and filters, we sure are excited to not have to use it as much. This will remove the need for 80% of the sources you're blending now and give you the functionality of Tableau, as if all of your data started out in the same source.
-
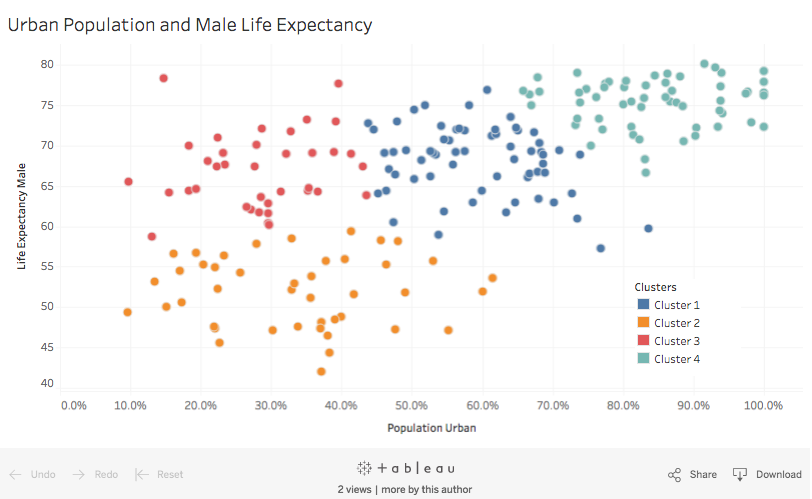
Clustering
We love seeing more features being added to Tableau's analytics pane! The latest featuring is clustering, which uses k-means to automatically generate clusters. Clustering is like grouping, but it combines multiple variables to reveal patterns you might not have found otherwise. Zen master Andy Cotgreave has a great primer blog post on clustering - read more here.

-
Bar Charts
With mark sizing in Tableau 10, you can now control the width of bar charts, which allows for new options for bars, and makes new chart types possible. This new feature also enables the creation of Marimekko charts, which are seeing a lot of buzz on Twitter. Check out Jonathan Drummey's awesome post on UC Berkeley 1973 graduate admissions data featuring Marimekko!

-
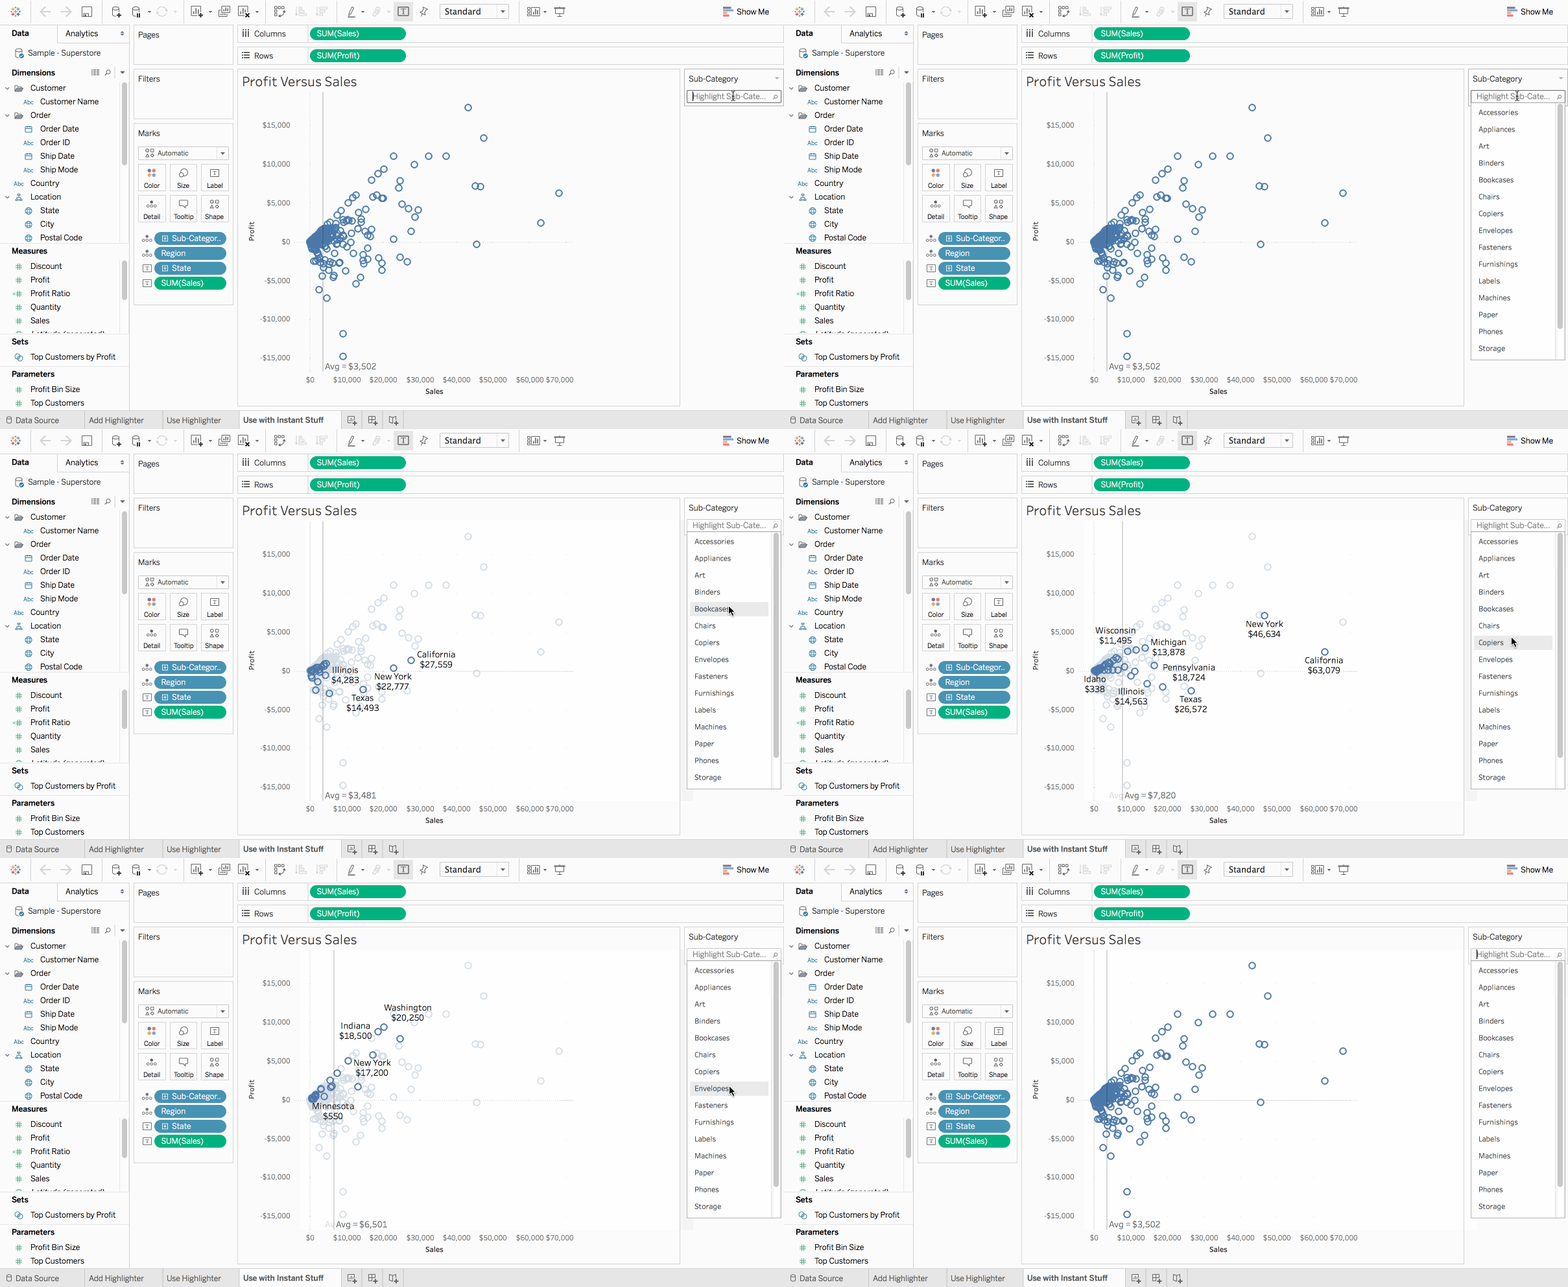
Highlighting
The new highlighter feature makes it easy to view a mark or a set of marks within the context of the other data in the view. It's a simple but powerful feature. Try using it with the "marks on highlight" label as a subtle way to add more information into the view! (Image from Tableau)

-
Redesigned Color Palettes
Tableau 10 brings the gift of awesome new color palettes. As Tableau's color expert Maureen Stone describes, the new palette's are "softer, more sophisticated, less 'Crayola bright'" - we couldn't agree more.

-
New Tableau Font
We can't get enough of the new Tableau font! The new font is specifically designed to move and accent your vizzes. Our favorite part? No more worrying about picking a font which will suit all devices and operating system; the Tableau font is built to be visible across systems and devices. It's tuned and optimized to download to devices and browsers simultaneously with other processes, so there's minimal to no impact to page-load times and mobile bandwidth! (from Tableau Blog)

-
Device Specific Dashboards
Our list wouldn't be complete without this feature. With V10, you can use your initial dashboard design to rearrange and resize sheets to fit any custom dashboard size. It's that easy!
Have you played around with Tableau 10 yet? Did we list your favorite new feature? Let us know in the comments!


