

by Amy Elliott, on August 4, 2016

There are so many technical aspects that go into creating a data visualization, ranging from exhausting data prep to reconciling advanced calculations. I'd like to argue that one of the …
Read Storyby Kayle Simpson, on August 2, 2016

A couple weeks ago, we discussed the differences between all of the awesome products that Tableau has to offer. In case you aren't aware, Tableau offers a suite of products …
Read Storyby Kayle Simpson, on July 26, 2016
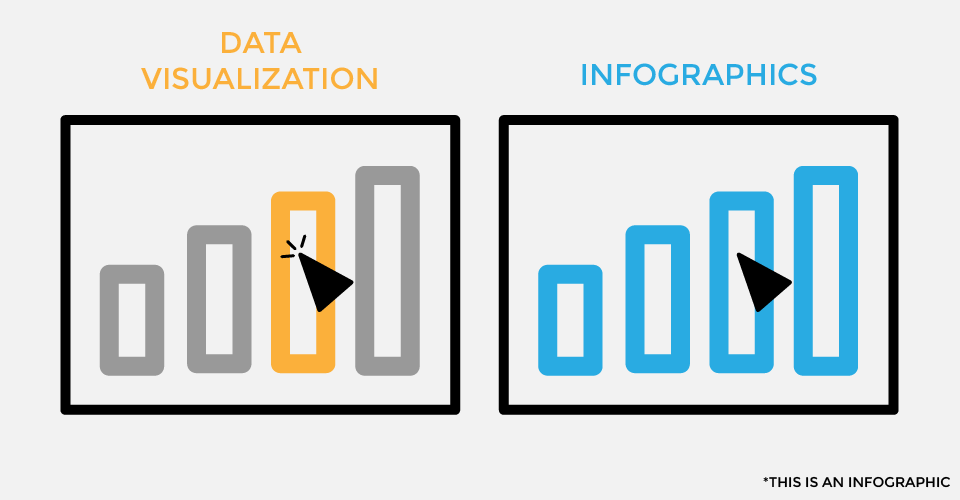
At Arkatechture, one of our specialties is Data Visualization, which often gets confused with Infographics, or Information Graphics. While all of these terms are similar and lmost the same (Data/Information, …
Read Storyby Katie Paige, on July 19, 2016

Hey there! As you may have gathered from our other posts and tweets, we LOVE Tableau here at Arkatechture. It's an awesome tool, and as a Data Visualization Analyst, I'm …
Read Storyby Kayle Simpson, on July 6, 2016

I've been the Digital Marketing Manager at Arkatechture for a handful of months now and I've become a little jealous that my coworkers get to have all the data fun …
Read Story75 Washington Ave., Suite 2D
Portland, ME 04101

