


by Jessica Dugas, on December 1, 2016
In early November, some of our Arkabots attended two very different conferences: our data vizzers went to the Tableau Conference, while our marketing team went to Inbound 2016. As a data company, we had to somehow incorporate data into these events, so we decided to track our steps during the conferences using our FitBits. Since the conferences just happen to land on the same days, we decided- in true Arkatechture fashion- to make a competition out of it. There “Team Tableau” & “Team Inbound” were born.
The Challenge
.png?width=402&name=Team%20(1).png)

Measurement: Since Team Tableau had one more person, we decided to measure average steps per day, per person.
Days of Competition: The Tableau conference was Monday - Thursday, and the Inbound conference was Wednesday - Friday, so the competing days would be Tuesday through Thursday.
Team Tableau had a strong start as Jamie and Katie have some of the highest steps per day averages within the company, however Team Inbound had our second best stepper, me!
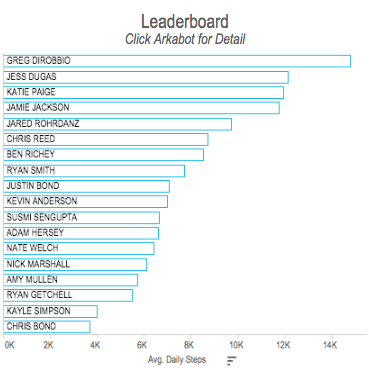
Additionally, Amy is one of the most competitive Arkabots, giving Team Tableau a distinct advantage, but Team Inbound was full of fire (or at least my NEED to win) and had to take a lap around the Boston Convention Center about every hour. After one day of the competition being announced, I believe Kayle & Ryan were tired of me talking about how much I wanted to crush Team Tableau.
How We Tracked It
Using Alteryx, we extracted the data from the Fitbit API into our data warehouse, known as ArkaBase. Then using the data collected in ArkaBase, we developed a viz in Tableau. You can learn more about Alteryx here!
The Results
(Click through to view on Tableau Public)
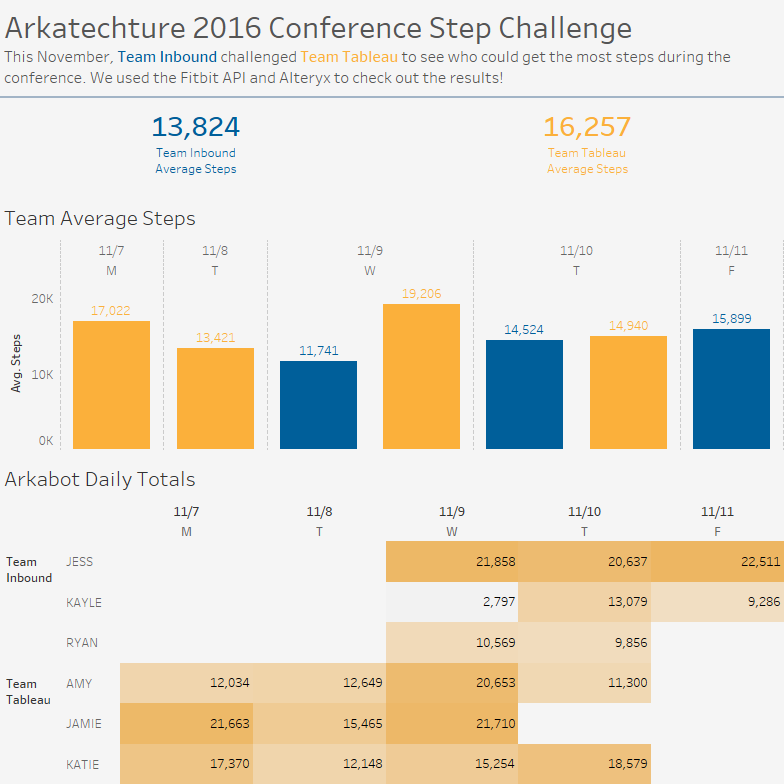
To my dismay, Team Tableau were the ones who came out on top. However, we ran into some issues that distorted our numbers a bit. First, on Tuesday afternoon, Kayle’s Fitbit reset itself as she went to sync, and started her day’s steps back at zero, which is why she ended with just under 3,000 steps (she had at least 5,000 before the data was erased). Second, Ben ended up having to work most of the week and wasn’t able to attend most of the conference, which played a role in his step count.
We’ll give it to Team Tableau this year, but Team Inbound hasn't given up, yet; there's always next year! Stay tuned!
To read more about our adventures at these conferences, you can check out our "Favorite Moments" posts for theTableau Conference and for Inbound!