


by Katie Paige, on November 15, 2016
Wow. We are back in the office today, still reeling from excitement from our trip last week! What a week it was. Thank you Tableau for an amazing conference filled with data, friends, learning, and tacos!
We started the trip off with our #VizzinQuest2016, our viz which automatically tracked our drive from Portland, ME to Austin, TX. We had a blast, with stops in Asheville, New Orleans, San Antonio, and Austin! If you haven't seen it already, be sure to check out our viz on Tableau Public. It also includes a detailed explanation of how we automated the viz, which pulled from four different sources, including Automatic, FitBit, AccuWeather and Twitter!
During the conference itself, we attended 20+ sessions, four awesome keynotes, and IronViz. We learned so much, and can't wait to put all of our new learnings to work. Already counting down to #Data17 in Las Vegas next fall!
#VizzinQuest2016: Portland, ME to Austin, TX
Some highlights from our Automatic data set:
- 2,248 miles driven (50% of all miles were driven by Jamie)
- 37.4 hours, or 2,241 minutes, of driving
- 1,135 minutes of driving over 70 mph
- 8 hard stops
- 0 hard accelerations (we were surprised by this too!)
Trip anthem: I Need A Dollar by Aloe Blacc - it's very catchy, and the chorus is easily changed to the lyrics "I need data, data, data is what I need - Tab-leau!"
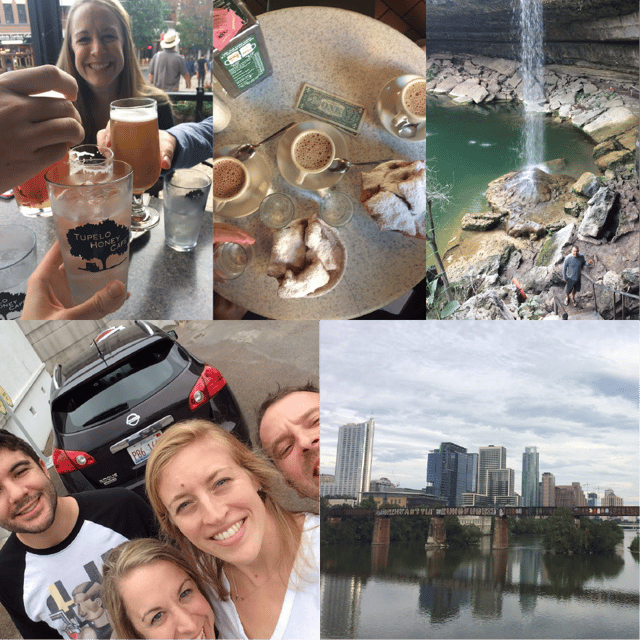
Left to right: (1) Cheers to our first big day of driving in Asheville, NC (2) Beignets at Cafe du Monde in New Orleans (3) Stretching our legs at Hamilton Pool Preserve, near Austin, TX (4) Saying goodbye to our rental car! (5) Enjoying the running trails in Austin!
#Data16
We attended over 20 breakout sessions, and all 4 of the keynote sessions! We're working on some blog posts which will highlight some of these sessions in more detail, but here are a few of our favorites with some key takeaways:
- Tableau Vision - Tableau's three year vision outlined progress in visual analytics (using machine learning for a better user experience and more insights), data engine (introducing Hyper), data prep (project Maestro), and collaboration (ask questions, use @ mentions, verify sources on Tableau server/online). We noticed a big shift here from data visualization to more a complete business solution. Read a great interview with Tableau's Chief Product Officer Francois Ajenstat from CMS Wire here
- Devs On Stage - So many awesome things to be excited about - we're jazzed for even tile distribution, automatic drill on maps, filter presets, database joins on calculated fields and database unions on more data sources
- 50 Tips in 50 Minutes (Jeffrey Shaffer and Andy Kriebel) - Whether you are a zen master or a Tableau newbie, there's always something to learn! There were so many great tips during this session, we highly recommend watching this session on Tableau Conference Live
- Busting Data Viz Myths (Matt Francis) - Understanding the history of best practices is important, so you know when it's okay to break the rules. Spoiler alert: pie charts are OK if you only have a few segments!
- Sealed with a KISS (Chris Love) - Simple viz, complex data NOT complex viz, simple data
- Practical Tips from the Trenches: Rolling Out Self-Service with Tableau (Ken Wong, Brandon Ralls) - the best way to promote self service is by building a community and "dog-fooding" whatever you're preaching to others. This is often lost in the mix, but is a critical step. This is one of the things we practice here at Arka, which is why we take such pride in projects like Arkabase and Office Intelligence!
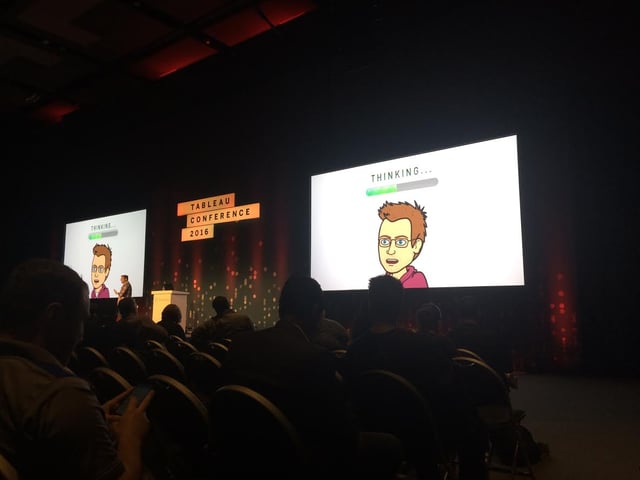
We loved Matt Francis' use of bitmojis in his awesome Busting Data Viz Myths presentation, in which he emphasized that it's important to understand how best practices come to exist so you know when it's OK to break the rules - to which we say:
#DataNightOut
As always, Tableau delivered on Data Night Out! We had an awesome evening meeting up with data friends, watching awesome live music, and eating great food!
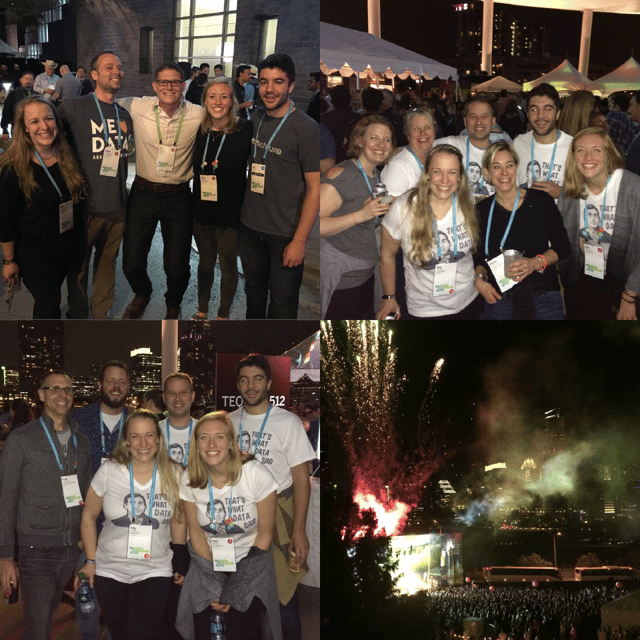
Left to right: (1) Meeting up with #VizzinQuest16 fan and Tableau Sales Manager, Ed Beaurain, at the Welcome Reception (2) Friends from St. Mary's Bank at #DataNightOut (3) Visiting with fellow Maine Tableau consultants from Stroudwater Associates (4) Atop the ferris wheel during the Walk The Moon finale (complete with fireworks!)