by Hannah Barrett, on September 22, 2021
The goals of a successful data analytics program
Through this 5 step process, you'll be able to increase operational efficiencies, support decision-making processes with facts, and better serve your customers & partners.
Transforming and updating your data analytics strategy and infrastructure can be a daunting task, but we break it down into 5 steps to guide you on this journey.

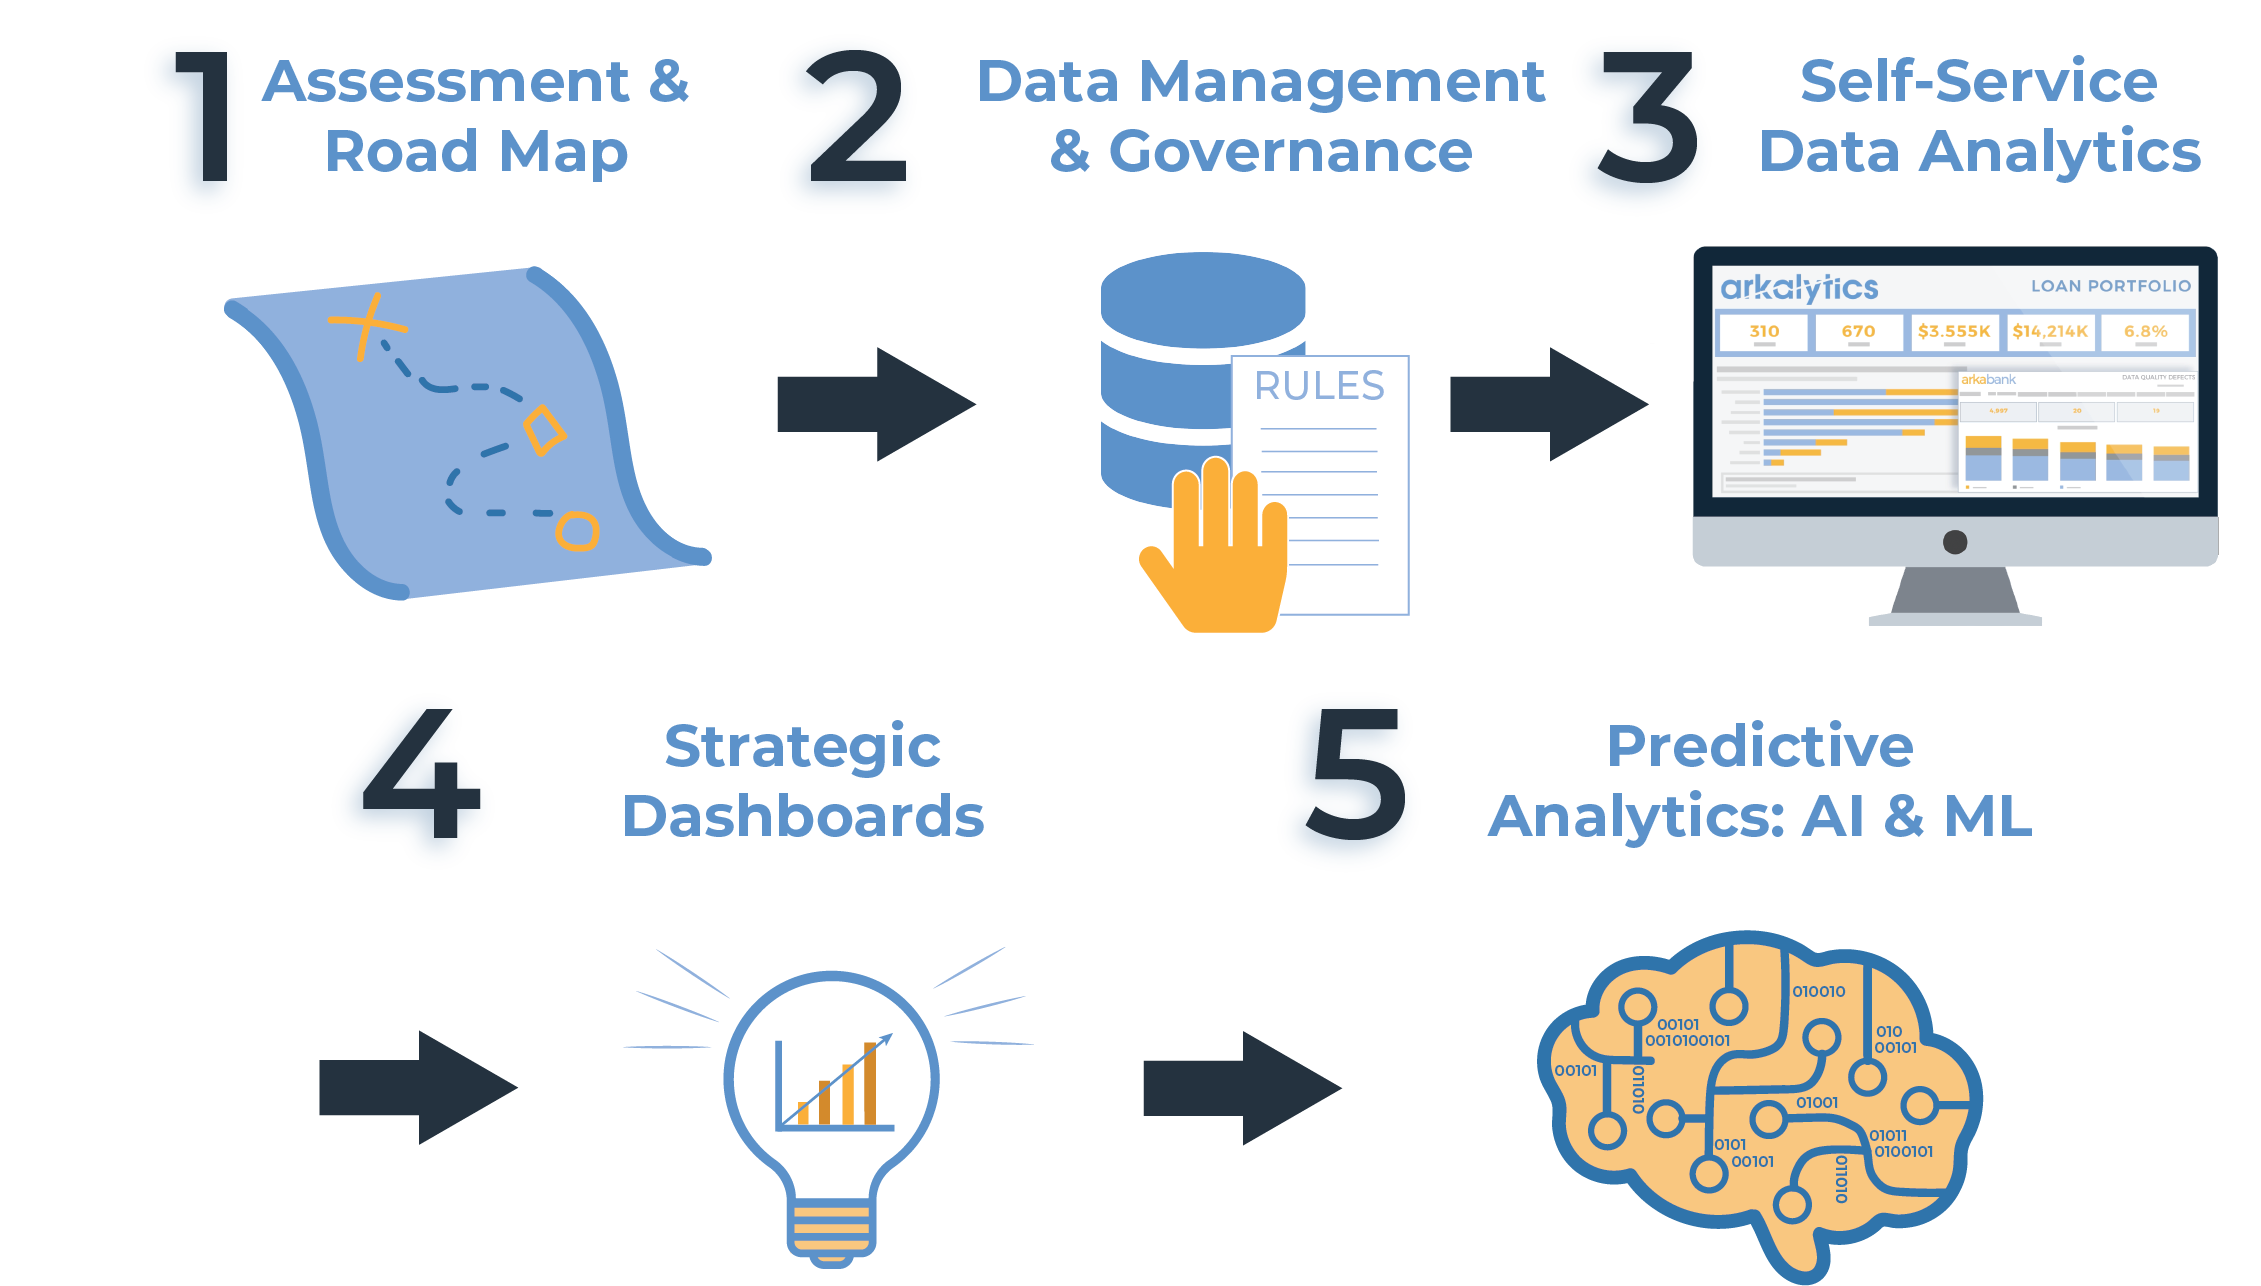
Breaking down the data journey into 5 actionable steps
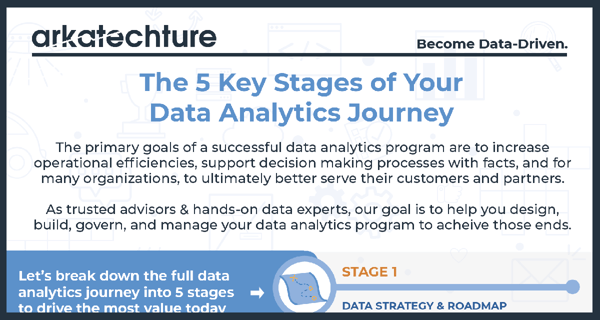
1.) Data Strategy & Road Map
A great data analytics program starts with a deliberate strategy, purpose-built and sized for the organization. It should consider factors such as available technology and the key stakeholders involved.
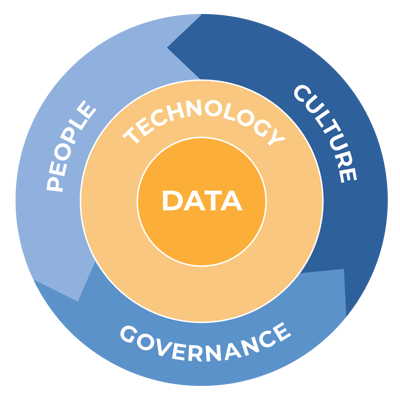
We begin many of our clients' data analytics journey with an roadmap of the 5 key dimensions of a successful data program. Starting with the strategic goals of the organization, we evaluate your data sources, technology infrastructure, people, culture, and governance practices to make sure everything is aligned to reach your goals.
As a result of this program, your team will receive time-bound recommendations that help you progress along your data analytics journey.
Next, we custom create an actionable data strategy road map to lay out every recommendation and step required to get there. During this phase, it's important that all parties understand and agree upon the Key Performance Indicators (KPI's) that ultimately demonstrate success of the program.
2.) Data Governance & Data Quality
Trust and confidence in your data is critical to creating value from your analytics efforts. Without it, any results will be questioned and debated, then subsequently ignored.
During this stage, custom data quality rules are implemented, and custom data infrastructure is built to house a clients' data. During this process, we make sure that the data being pulled in from systems is accurate, trustworthy, there are no duplicates, and the right people have the right access to what they need. Designated data stewards are identified at the clients' organization, who validate the accuracy of everything before it's published.
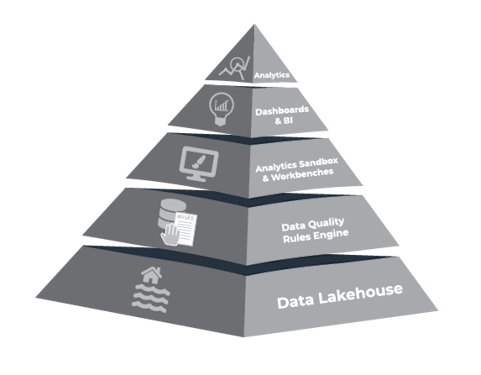
During the data platform building process, we find ways to integrate clients' source systems into one central location (in a data lakehouse or similar). Once the data is in the data warehouse, the client has the single source of truth they need to move on to step 3.
3.) Self Service & Workbenches
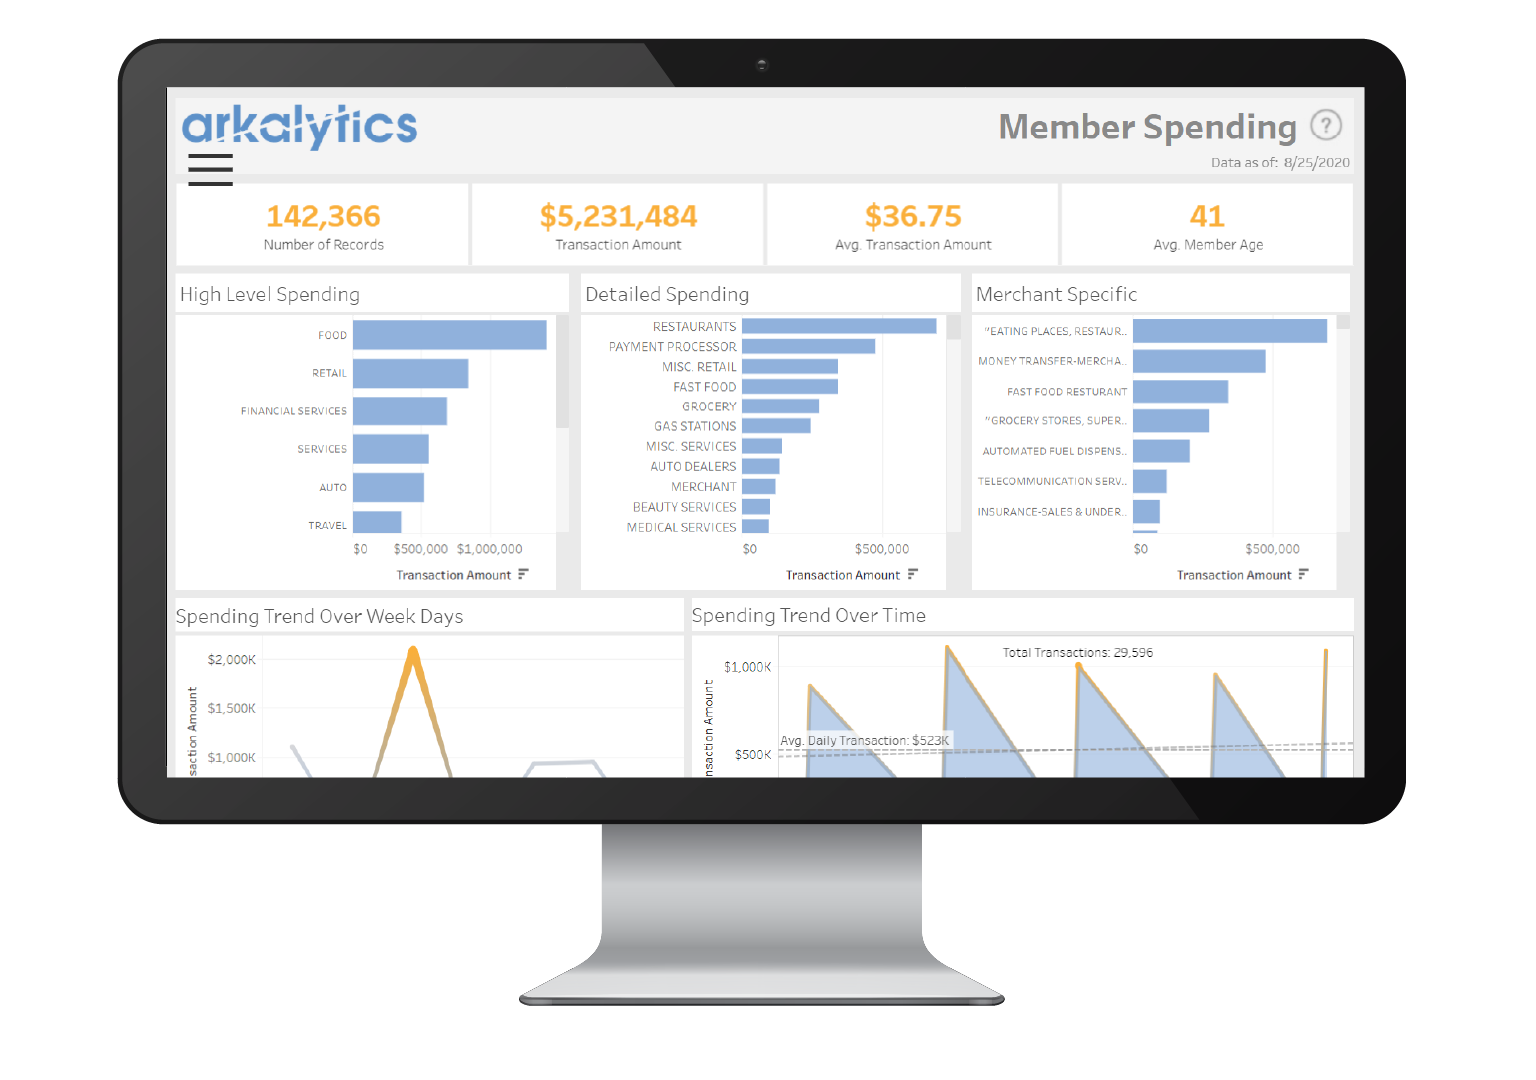
Once a clients' data infrastructure is set up, their conformed and cleansed data is automatically updated into an array of visual dashboards which tackle a variety of areas to answer important business questions. These dashboards can be used by anyone at the organization, to answer any questions quickly, and on-the-fly. Data sets can be sliced and diced easily with workbenches, with little to no technical skills required.
Custom dashboards can also be made to compare specific data sets, and answer specific questions. Once the data is all in one place, you can look across your whole business. All systems are combined to compare in one place. Combine key KPI metrics from across the organization into one executive dashboard, to easily view and examine all at once.
4.) Strategic & Ops Dashboards
Already able to answer ad hoc questions with ease? It's time to level up.
This stage involves a deep dive into individual roles and duties. Interviews will take place to identify key performance metrics to guide the design of tailored dashboards.
5.) Predictive Analytics, AI, & ML
The ultimate end goal for data analytics programs is predicting what will happen next.
Once a clients' present and historical data is plugged into their dashboards, they can start forecasting, and preparing for the future, making data-driven decisions proactively rather than reactively. With the proper descriptive data in place, models can be created to predict user behavior and financial performance to stay one step ahead of customers & competition. Refresh the data daily, hourly, or even near real-time.
Machine learning models can be built, trained, and continually improved over time. With machine learning, clients can build accurate forecasting models, and automate other important models.
We hope this helps break down the process, make it less daunting, and lay the framework for you to understand what your data journey might look like, and where you can begin to continue your analytics journey!
Who is Arkatechture? Allow us to introduce ourselves.
Arkatechture is a full-service data analytics consulting firm. We support businesses of all shapes and sizes through our professional services and data analytics technology platform, Arkalytics.
As trusted advisors & hands-on data experts, our goal is to help you design,
build, govern, and manage your data analytics program to achieve those ends.
Want to learn more about embarking on your data analytics journey?