What is Data Visualization?
by Hannah Barrett, on June 21, 2021

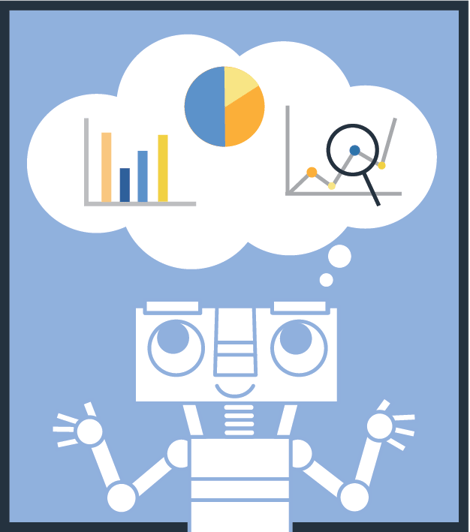
Pie charts, bar graphs, and plots may come to mind, with different colors representative of the data behind them. This is a good start, but today, there is so much more to data visualization. Data visualization and dashboards are an extremely powerful tool for every organization, and every department of every organization. So why? And what do they do?
What does data visualization do?
Data visualization allows decision-makers and other key employees to access reliable insights that visually lay out the answers and solutions for the success of their organization. For example, organizations can use the patterns and trends presented in data visualization to make data-based product development choices and roll out offerings that are tailored to the needs of their clients or target market; the key to differentiation.
Why is data visualization important?
Data visualization transforms data into imagery that can easily be interpreted. The human brain is not equipped to draw conclusions from viewing raw, unorganized data. In fact, humans process images 60,000 times faster than text; we are visual by nature. Visualizing data in this way makes it easier for our brains to identify trends, patterns, and outliers.
Data Visualization can help companies spot which areas are in need of improvement, which ways they can increase customer satisfaction, the bottom line, and what moves to make with their products and/or services. Data visualization also makes it much easier to see correlations and relationships between variables.
Data Visualization Dashboards
Some data visualizations are even available as interactive dashboards that allow you to filter information, and drill down to details in order to answer specific questions on the fly.
Check out our Tableau services page to explore some interactive data visualization dashboards for yourself!
Want to learn how data visualizations can streamline reporting for credit unions specifically?


