


by Katie Paige, on November 3, 2016
Like everyone attending this year's Tableau Conference, we're excited. REALLY excited. Why? Awesome sessions, keynotes, and data friends, of course. But most importantly, because of our favorite Arkatecture tradition: the Vizzin' Quest!
At 12 am this morning (that's MIDNIGHT), Jamie, Ben, Amy, and I (Katie) embarked on a 5 day- 2,376 mile adventure to Austin, TX - all in one neat little mid-size SUV.
You might have seen our killer viz from 2014 - the original Vizzin' Quest. We have to say, it was pretty cool for it's time. We tracked a bunch of variables manually, including happiness, break duration, temperature, gas price and driver. We used a GPS Trip Recorder to track our route (as well as the barometric pressure, of course!), and published manually to Tableau Public on not-so regular intervals.
Over the past 3 years, things have changed. We've gotten new tools, new features, even talented new Arkabots. We've learned awesome new tips and tricks. So, over the last few months, we've been building what we think might possibly be the best road trip viz EVER! We've included a bunch of details below, but without further ado...
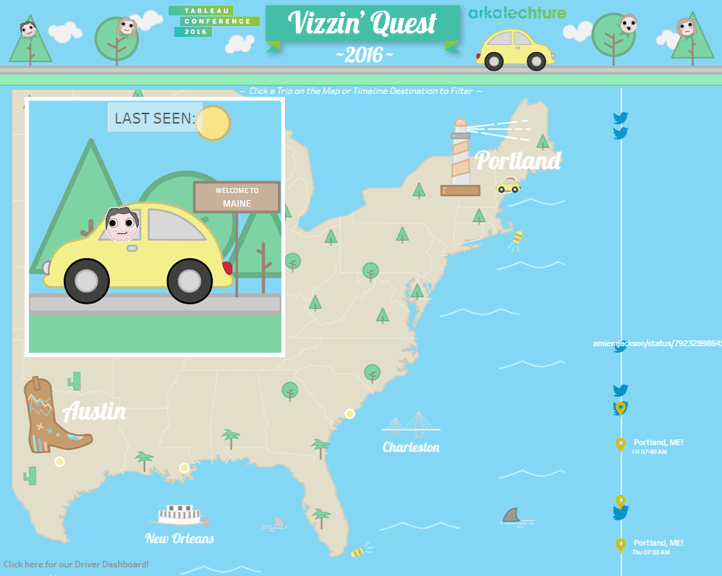
Presenting Vizzin' Quest 2016!
Here's how it's built:
Like we mentioned, we've been lucky to learn a lot of new things in the past few years. One of the biggest new tools is Alteryx Server - that's what enabled us to pull most of this data together. The other key component to our viz is Google Sheets. The Tableau Public 10.0 Google Sheets connector unlocked a new realm of possibilities for our viz. We're pulling multiple data sources into multiple tabs, and are then able to join and union those tabs together in Tableau. And we can schedule a data refresh nightly/manually. So cool! Our process looked something like this...
-
Connect to Automatic API through Alteryx and decode the Google polyline into Lat/Lon records
-
Connect to Fitbit API through Alteryx
-
Connect to Weather Underground API through Alteryx
Like everything at Arkatechture, all this data is centralized in our data warehouse - Arkabase! Using Arkabase, we pulled together our data and created the viz:
-
Write views from the tables to aggregate and conform the data
-
Use Alteryx to write the views to Google Sheets and schedule through Alteryx Server to run every 30 minutes
-
Pull tweets from Twitter directly into Google Sheets via IFTTT
-
Union Automatic trip data and Twitter data together in Tableau Desktop, join in Fitbit activity data
-
Develop viz in Tableau Desktop
-
Pull in custom graphics (thanks Kayle!) hosted in AWS S3 buckets
-
Publish viz to Tableau Public
-
Use Selenium browser automation to click the Tableau Public refresh button for Google Sheets data sources every 15 minutes
If everything runs smoothly, the dashboard should be updating every half hour.