


by Katie Paige, on October 18, 2016
It's hard to believe that the Tableau Conference 2016 is ALMOST here. There are so many things to be excited for - Data Night Out, Bill Nye, exploring Austin, Iron Viz, meeting up with data friends new and old - the list goes on and on.
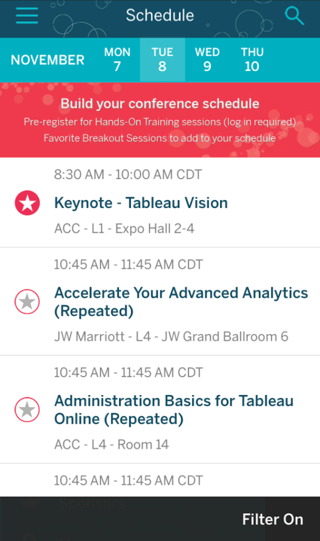
If you needed one more thing to be excited about, the TC16 app was just released this weekend! This is an awesome resource which will become your lifeline during the busy days of TC16 - it's jam packed with everything you need to know, from where to find Bits and Bytes stations (hello, free food) to when and where the shuttles will be running for Data Night Out.
Another great feature on the app is the ability to sign up in advance for breakout sessions. These provide great opportunities for hands on working sessions with awesome speakers - you can play with the data yourself, ask questions, and learn a ton. We highly recommend them!

(Does that guy look familiar? It's our very own Chris Bond!)
With 500+ sessions, how can you pick just a few? The good news is - you don't have to. Most sessions are filmed, so if you end up in a pinch, don't worry! When we pick our sessions, we opt for sessions with speakers we love, topics we're unfamiliar with, opportunities to see Tableau in action, and interactive breakout sessions. It's hard to scroll through the list of sessions and not want to attend them all, but here's a handful of sessions that we're excited for.
5. Supporting Eradicating Malaria in Zambia by 2020 - Jeff Bernson (PATH), Anya A'Hern (DataBlock), Jonathan Drummey (DataBlick), Allan Walker (Slalom)
The Tableau Foundation and PATH have been working together since 2014 on their #VisualizeNoMalaria campaign, in support of the Zambian Ministry of Health's initiative to eliminate malaria by 2020. This session overviews how volunteers have used "Tableau, Alteryx and Mapbox communities to develop dashboards, alerts, and predictive models to support the work in Zambia. [ They will ] present a technical overview of the Tableau dashboards built to support the data pipeline, geospatial and predictive analytics using Alteryx, Mapbox, and Tableau, and VizAlerts for distributing dashboards to a variety of staff in Zambia." Of course, this promises to be an inspirational case study of using data for good, but we really can't wait to see the behind the scenes view!
4. How to Build a Culture of Data-Driven Analytics - Paul Lilford (Tableau)
If you follow our blog, you know this is something we strive to do every day at Arkatechture, both in house (did you see our Data Developer post?) and on site with our clients. We can't wait to see what tips Paul has in store!
3. Busting the DataViz Myths, Zen Master Style - Matt Francis (Welcome Trust Sanger Institute)
We love when people ask stop to ask "why?"! This session will help explain why certain rules and guidelines have come to be in the data viz world, including everyone's favorites:
"'Pie Charts are Evil'
'Red and Green should never be used'
'You should never truncate the y-axis'"
Can't wait to see Matt's take on these and other #dataviz best practices!
2. 50 Tips in 50 Minutes: Tableau Speed Tipping - Andy Kriebel (The Information Lab), Jeffrey Shaffer (Unifund)
Having become a huge #MakeoverMonday and #TableauTipTuesday fan this year, I personally can't wait to see Andy in action! Jeff and Andy will be racing against the clock to fit in as many #TableauTips as they can. With this killer speaker combo, it's practically guaranteed that everyone will come away from the session having learned something new!
1. Digging into Your Data Structure to Fix Tough Calcs - Bethany Lyons
We are huge (HUGE) Bethany Lyons fan girls over here - she is an amazing presenter, so smart, sharp and witty, with an infectious love for Tableau! After her first session last year (LODs of Fun with Level of Detail Calcs), we were hooked. Did we go to all three of her sessions? You bet. Would we do it again? You bet!
Will you be at the conference? Let us know by tweeting @Arkatechture or using the hashtag #Data16! Can't wait to see ya'll in Austin!!