


by Hannah Barrett, on November 16, 2022
Why is dashboard customization important?
Being able to create custom dashboards is essential for financial institutions. The three most common situations for data visualization being:
- Executive level dashboards to understand the health of the business
- Department-focused operational dashboards
- Self-service workbenches for no-code, ad hoc analysis targeted at the average user
The first and third options, you can build once and then improve over time. The second one, however, is always changing. Each department will take on new projects and responsibilities which inevitably need to be measured to understand their impacts.
Having both the technology AND the skillset to manipulate data to tell a factual story about one aspect of the business are the minimum requirements to build custom dashboards. Approximately 80% of the time achieving these insights is usually spent wrangling and transforming data, with 20% focused on actual business analysis & presenting the data visually.
This is where Arkatechture steps in. We work with our clients to reduce the time spent wrangling data and instead spend that 80% on higher value tasks.
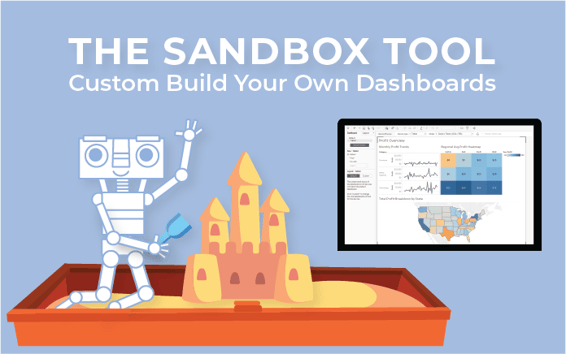
Dashboard Customization - The Sandbox
The Arkalytics team takes care of the the foundational data management work to make dashboard customization much easier for your analysts. Our credit union clients have utilized this capability to create custom dashboards to address existing and emerging use cases that require accurate information to make data-driven decisions for the business.
This customization capability is unique and valuable. Arkalytics users have access to write custom SQL queries, giving your analysts the tools to explore your data and discover new insights with heatmaps, geographical maps, and trendlines.
What can you do with the Arkalytics Sandbox capability? Here are a few quick examples:
- Run ad hoc queries at a moment’s notice to respond to business questions
- Build queries that your business regularly needs
- Create custom dashboards in the Sandbox environment using the Data Lakehouse
- “Self service” your business requirements as opposed to Arkatechture building it for you
- Create custom extracts to automatically feed into other fintech partner solutions
Let's dive into some real life use cases!
ORNL Federal Credit Union - The Transaction Heatmap
The ORNL FCU team knew that constructing a transaction heat map would be a very useful tool for them, and with Arkatechture's help, they built one.
![]()
With this tool, they could now section out all transactions and the different channels the credit union had available. The heat map allowed ORNL FCU to see all transactions conducted through any given channel in any given time range. The heat map shows when members are in the branch conducting transactions, and when the most transactions occur, serving as a window into the day-to-day operations of every branch. They also added a feature to filter to see only digital or phone transactions.
The transaction heat map allowed them to more efficiently staff their branches based on when transactions were happening most frequently, and what kinds of transactions were being made.
St. Mary's Bank - Branch Activity Analysis
Using the Arkalytics Sandbox capability, St. Mary's Bank built a dashboard to track branch activity in order to find the most efficient way to staff their branches, and serve their members.
After closing their lobbies during the Covid19 pandemic, and only having their drive-ups open - St. Mary's Bank Built a report that was able to show any differences in branch activity.
This allowed them to assess and answer questions like: was there an increase or decrease in branch activity after that even occurred? And based on what they saw in the report, figure out how best to react, and allow their SPG or retail staff to help out their membership if there were any problems.
Learn more about St. Mary's Bank's Data Journey Here
Would your business benefit from dashboard customization capability?
