5 Ways to Improve your Data Governance Program
by Judith Bernholc, on December 13, 2022
This article was originally published on CUTimes.com
 Where to Begin
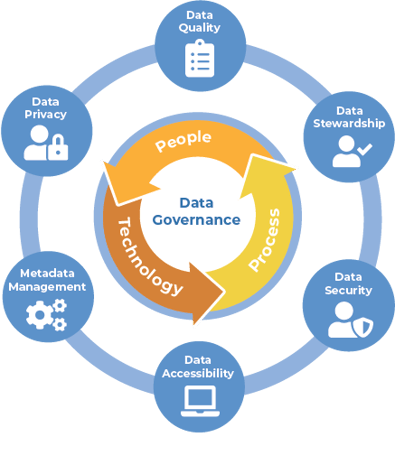
So you're ready to build or maybe even overhaul your credit union's data governance program. You've already proven that data is a valuable asset for your business and your members. Now, it's time to layer on additional processes and procedures to create structure for your data management and analytics practice.
Although this guide isn't meant to be an end-to-end plan for starting from scratch, it will give you critical pointers when it comes to organizing and governing your data warehouse. Ultimately, your data governance efforts should build trust in your business intelligence efforts which helps you make decisions backed by historical data trends.
Incorporate these five data governance tips to get started:
- Data Quality Rules Engine (DQRE)
- Source-to-target mappings (STTM)
- Data Dictionary
- Reference tables & shadow updates
- Adoption dashboard
 1. Data Quality Rules Engine
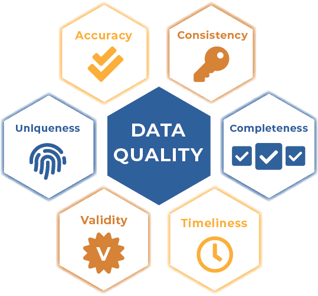
There’s a reason that the data quality comes in at No. 1 on this list. Data quality functions as a programmatic foundation to write, enforce and assign accountability to a set of “rules” defined by the business. We recommend automating and tracking your data quality – typically, this is deployed alongside your data warehouse or data lakehouse. It uses metadata and timestamps to track your progress over time so you can measure data defects vs. successful data cleanups.
One example of a helpful data quality rule would be “open accounts that are missing an email address.” Your system is built to allow new accounts without an email address, but perhaps your marketing department wants to lower the number of accounts with missing email addresses so that they can better communicate with their members.
Marketing suggests running a direct mail campaign encouraging members to associate their email address with their account to take advantage of an exclusive offer. Let’s say 15% of recipients respond to the campaign and take the desired action. Now we can both measure the success of the campaign and track the improvement on that specific data quality rule.
2. Clear Definitions From Each Source
Mapping each field and table from each data source into your data model is another critical component of the data warehouse process. Documenting these will help in the future when new fields are added or removed from either the source or target systems. Overall, this is another way of documenting your business logic into written form.
Many times, the mapping may be clear and obvious, but other times not so much. If multiple source systems all have a unique “member ID” field for each member record, then you may need to choose one as the overall primary key and store the others as associations. When you really get into the weeds, you’ll also have to take into consideration the destination and target data types. For example, if your “member ID” field is alphanumeric in the source system, you’ll need to make sure the target data model has a field that can hold alphanumeric characters and not just integers.
This process is a collaboration between the business users that have an understanding of the business logic and any important calculations alongside an experienced data or business analyst that can translate everything into SQL or other common database languages.
3. Data Dictionary
As an additional source to your definitions, your data dictionary will be a huge asset in documenting specific terms, calculated fields and other important data assets. Compiling a data dictionary is important especially as your internal user base gets more access to dashboards and reports. Supporting that rollout to more business users with a data dictionary will save your team a lot of time and additionally future-proof your investment against turnover or loss of knowledge over time.
An example in the banking industry can be taken from the Federal Reserve Bank of New York. Take a look at the data dictionary it published along with an Equifax credit report to provide additional context to anyone consuming the information within the report itself.
Building a data dictionary from scratch is quite a large undertaking for any business. One way that credit unions can avoid tackling this alone is to leverage a CUSO with a credit union specific data model that contains many shared definitions. From there, the business can define any custom fields or calculations on top of what is shared within the industry itself.
4. Referenceable Hierarchies
A large aspect of data governance is managing and accounting for who has access to what. At the same time, you’ll want to make sure that the people who do need access have it. One way to accomplish this is through the use of specific reference tables.
Let’s say the loan department has a large list of different loan types they use on a regular basis. The loan department also works to introduce new products to market, so they need to be able to add new loan types on a semi-frequent basis. One way to grant them this access is to develop a process where they can update and upload, say, an Excel file to a secure location that updates a reference table with the latest loan types.
The loan department doesn’t require administrative privileges to update the database itself, but instead it has a predefined process to update a specific reference table with an easy-to-use spreadsheet. They simply add the new loan type code and loan type description, upload the file, and then the database checks for the file and updates the reference table without any further intervention from the analytics team.
This approach combines the secure, controlled access requirements of the data governance program, but still gives the loan department the flexibility it needs to carry out its daily roles and duties.
5. Adoption dashboard
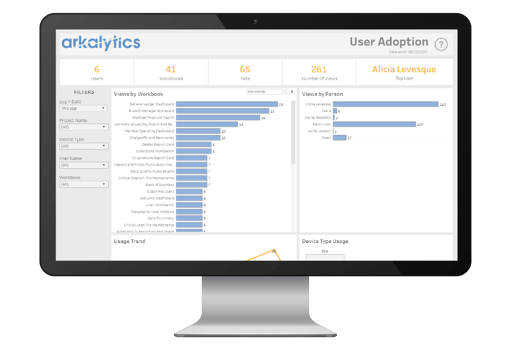
- How are your users interacting with the dashboard that you’ve built?
- Who are your top five power users?
- What dashboards are being used the most (and the least)?
These kinds of questions will start to arise as your data analytics program matures. You’ll want to know how your internal users are interacting and engaging with the content they’ve requested in the past.
Building a user adoption dashboard is one way to track usage trends over time when you’re investing heavily into your data analytics. One way you can use this is to manage paid licenses. If one user is no longer logging in, you can easily look at the data and swap a license over to another executive or manager who will use it more actively.
Returns on Investment
Investing the time and energy into your data governance program pays dividends in the long term. You’ll better understand historical data trends and increase your ability to act upon insights discovered from focused data analysis. Review these tips at your next data governance committee meeting and take control of your data journey.
Learn more about how you can build or overhaul your data governance program here!


