Outdated reporting harms your bottom line, automated business intelligence can help
by Arkatechture, on April 18, 2019

As an executive, you need to be moving your company constantly in the right direction, but you need to have solid data from which to draw conclusions. Outdated data collection and organization processes can lead to faulty reporting that hurts your bottom line.
Outdated reporting leads to missed opportunities
Rapid technological advancement is making the traditional method of organizing business information obsolete.
Segmenting departments helps organize workloads and keeps employees focused. If departmental data is segmented, however, then the complete data picture of company operations is being broken into puzzle pieces. These pieces may feature the same information presented differently and might not fit together in the end.
For example, your company may use both a content management system (CMS) as well as a customer relationship management system (CRM). If one system refers to "customer service data" and the other labels it "customer experience data", it will look like two different data entities when really it's just one. Fixing this issue manually would requires hours of work and fact-checking, slowing down the reporting process and reducing its overall value. Proper data governance procedures joins these two pieces of information together at the data level and then accurately presents them as one data point. This negates the need for time-consuming information reconciliation work.
In the traditional model, it was common for executives to go with "gut feelings" when making business decisions. While this became a desirable leadership quality, it originated for one primary reason: It was the only option. Before the digital transformation, the C-suite had no choice but to use the available (incomplete) information and make an educated best guess.
An automobile manufacturer, for instance, may see that its commercial truck segment sold more than its consumer vehicle segment. Based on this data, the company pulls resources from consumer vehicles and dedicates them to commercial trucks. However, what the executives don't know is that demand for consumer vehicles is higher, and the only reason that the brand's models are not selling is due to underlying safety concerns discussed in 87 percent of phone calls to the company's customer care center. Since the automaker's data is siloed, crucial context goes missing. That leads to flawed decision-making.
By the time the company identifies this problem and manually compiles a new graph to reflect all of the information, the new quarter is already well under way and the organization has already allocated resources. The data will no longer be valuable. Even if it manages to roll out timely reports via manual processes, the leaders reviewing the insights they contain are likely to spend much of their time assessing the veracity of this information.
In the end, this saga hurt sales. The organization, in response, may hire more analysts to help make the reports, further wasting resources on a problem that could be solved with clean data that assists decision-making through the use of data visualization and automated data preparation processes.
Data visualization reduces time to insight
In the traditional business workflow, gleaning actionable information from data happened slowly. To take an example from the customer experience, it meant that pain points found within the product lasted longer before they were fixed. For instance, a financial services firm with a malfunctioning online account management portal might not become aware of this issue until multiple customers file complaints in person.
Data visualization speeds up this process, while automating business intelligence workflows and ensuring accuracy. Now, companies will see how their customers are using the product that much faster through clear, visual images.
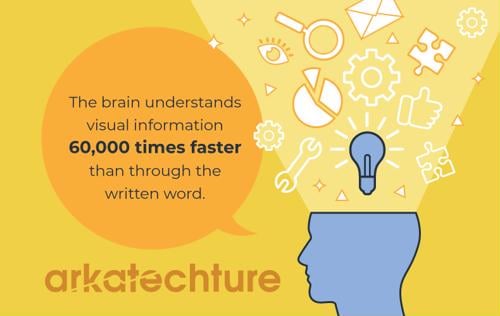
At the University of Minnesota, researchers discovered that the human brain can understand visual information roughly 60,000 times faster than through the traditional written word. Imagine your organization acting 60,000 times faster with clear, automated data workflows.
Data analytics, data visualization and cracking big data
Many analysts within the corporate structure spend very little time analyzing. Why? Their hours are devoted to gathering data and constructing reports. Although rudimentary data visualization has always existed in the form of pie charts and bar graphs, this information had to be assembled by human hands. Employees would read and process spreadsheets before manually creating the visual presentation, a time-consuming procedure that prevents staff from addressing other duties. Not only is this process slow but it runs the continual risk of human error.
Today's technology has created programs that can use data analytics - a process that often involves machine learning and mining algorithms - to read the information and dissect it for trends. It can also generate accurate, complete data visualizations, letting the company see a reliable image of how all the data are trending. Advanced solutions provide information much faster than the old methods of data collection, giving executives actionable data and stronger business intelligence.
Utilizing data visualization solutions can help your company understand the big data of today and rapidly transform it into actionable information that leads to superior operations and a stronger customer experience. Arkatechture research has shown that proper data visualization can provide your organization with deeper consumer insights, reduce the amount of hours needed to input data, allow a faster onboarding process for clients and cut the costs associated with that setup by as much as 89 percent.


