by Hannah Barrett, on February 13, 2024

iQ Credit Union's Data Journey
iQ Credit Union's data was spread across many systems like their core, online banking, loan servicing, and other data sources. They had never had a data warehouse before and they didn't have the internal resources to design, build, and maintain new data infrastructure on their own. Instead, they looked for a partner who had both the ability to host a data warehouse and the industry knowledge to help them analyze their business and get more value out of their data.
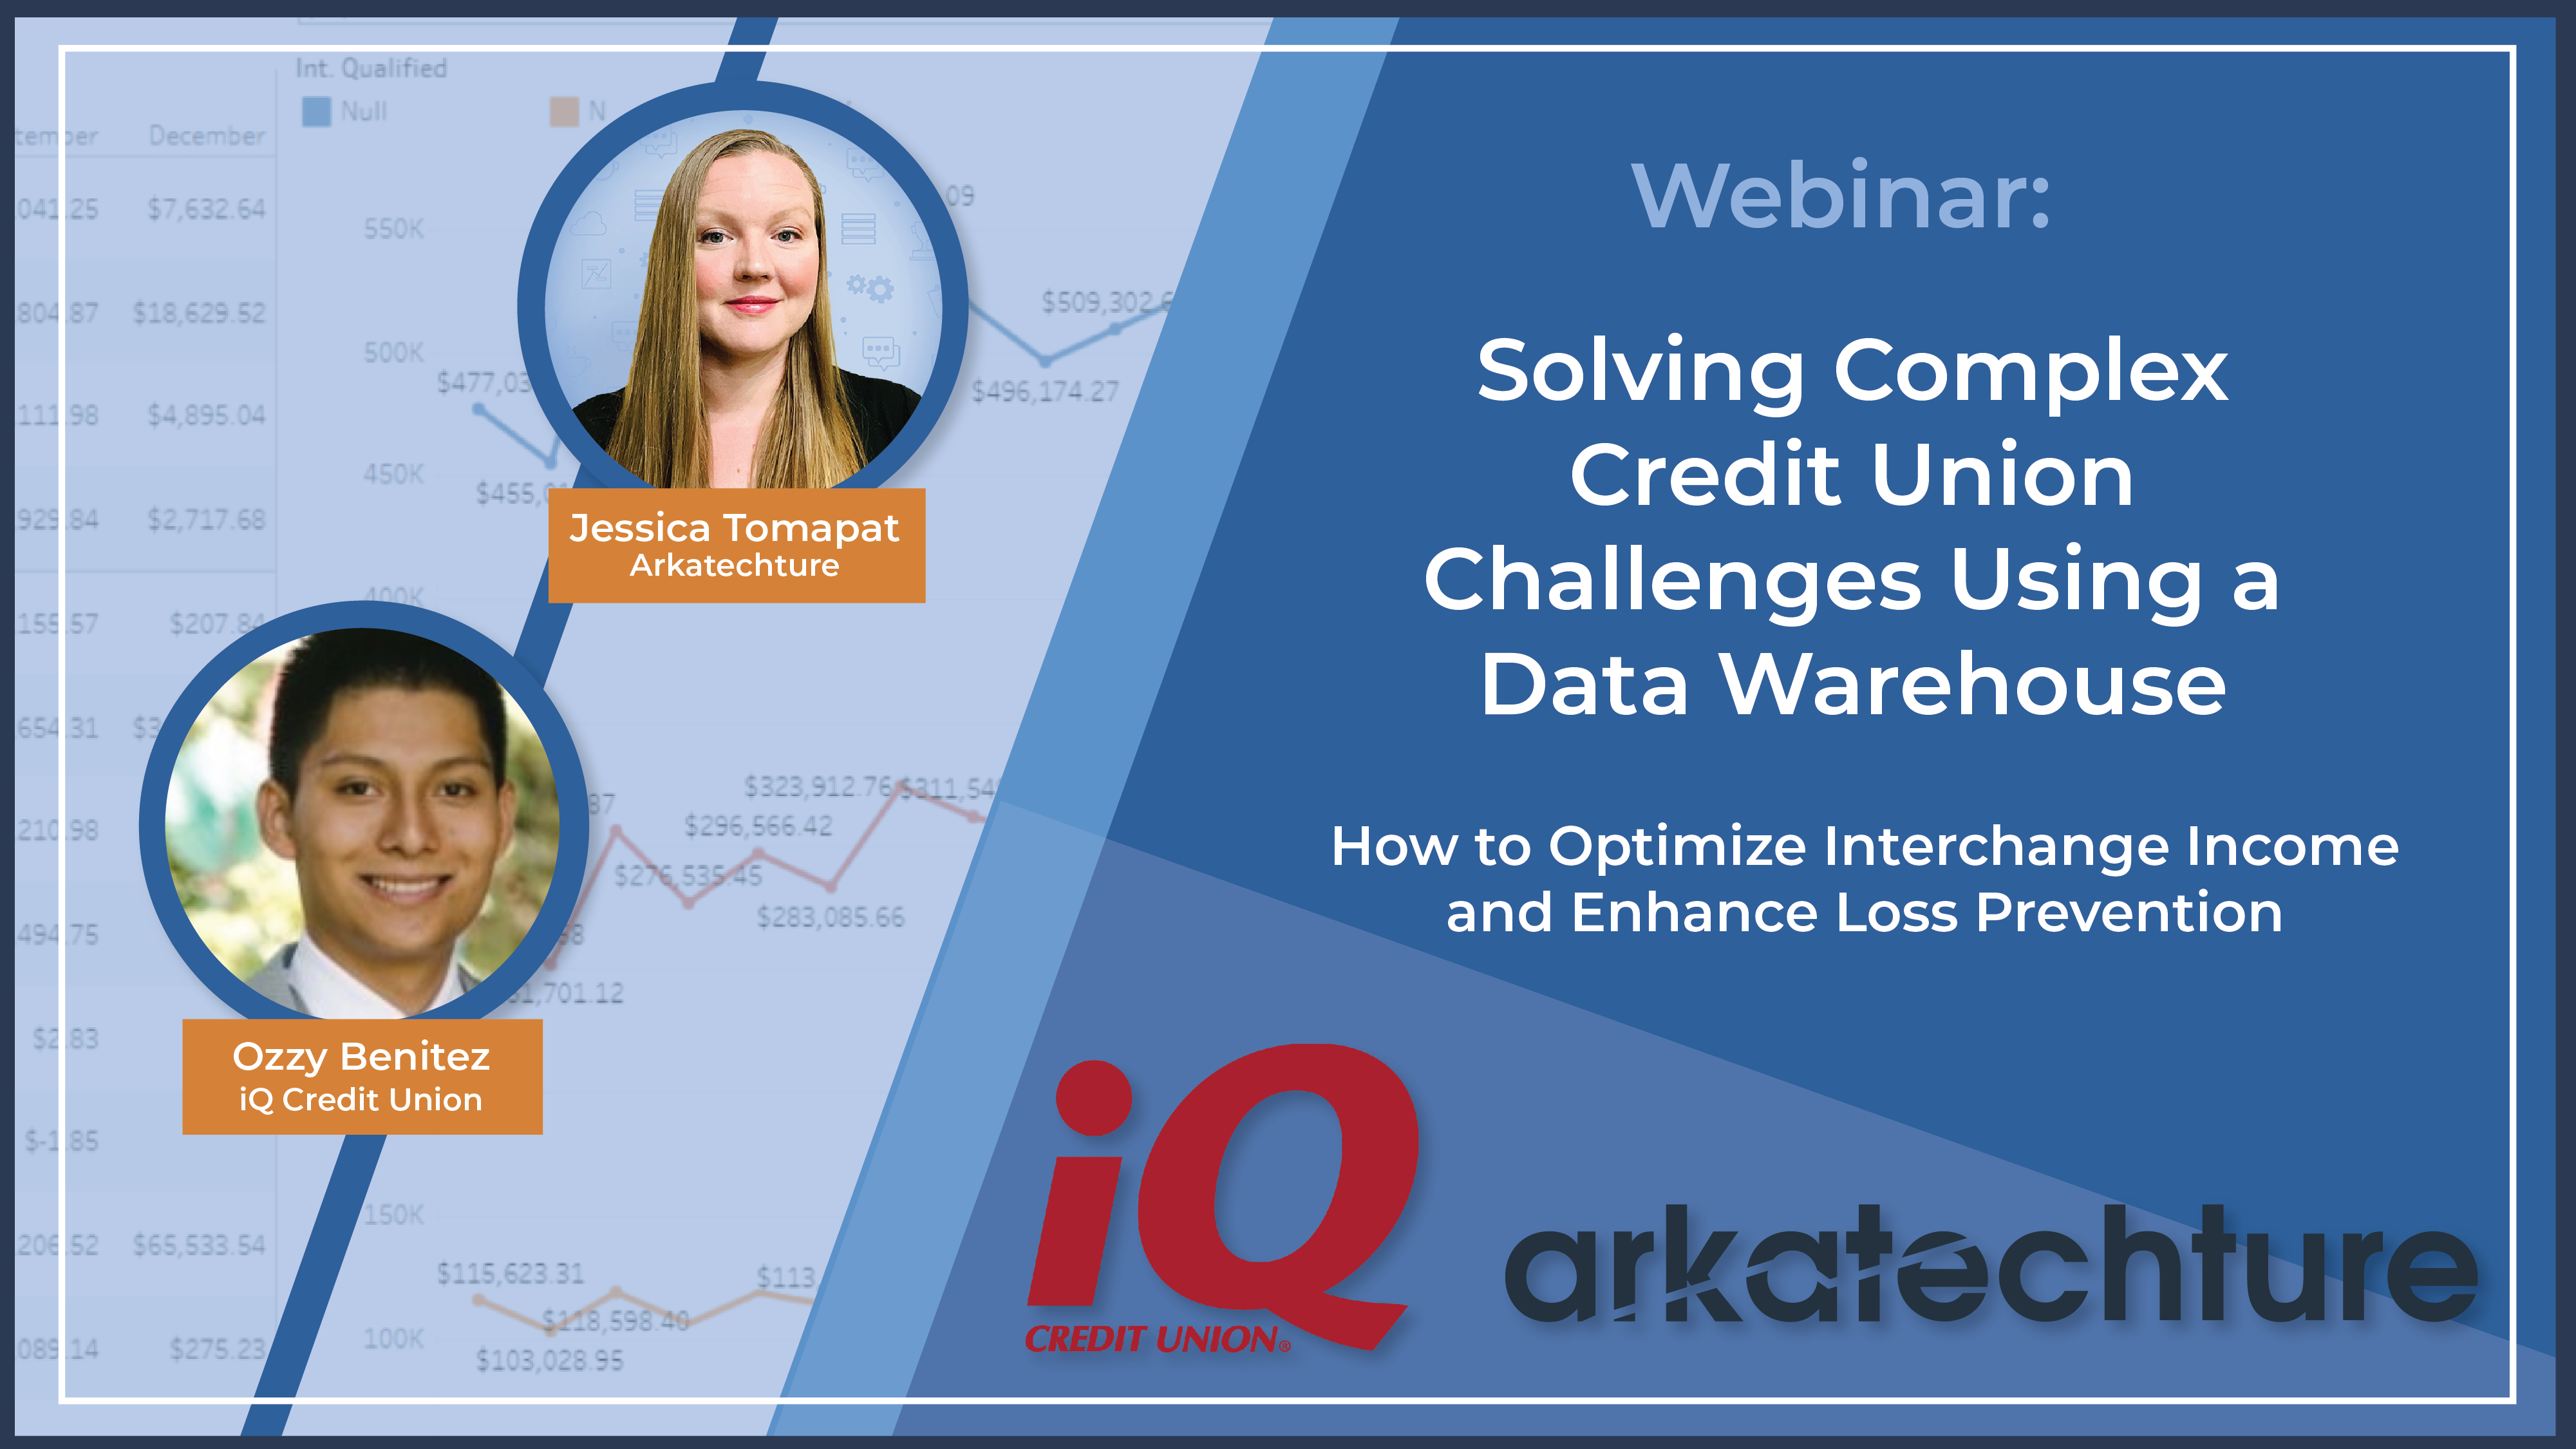
After assessing its options, the iQ Credit Union team chose Arkalytics as the best fit for their data analytics upgrade initiative. Today, the iQ Credit Union team is empowered to build custom data visualizations to analyze new business challenges; such as boosting interchange income as an alternative to overdraft fees. Additionally, they sought to reduce costs by identifying and preventing charge-off losses. To hear the full story and see their custom-built dashboards, check out the full webinar recording here!
Analyzing Interchange Income with a Custom Dashboard
The goal of the interchange income dashboard was to understand the correlation between the cost versus the income of their product, Intelligent Checking. After utilizing Arkalytics to build this dashboard, they can now drill down to product-type, and analyze performance over any given time period. Using this, they were able to identify that their Intelligent Checking product is successful and it even helped them ask new questions, like how can we expand the product to more members?
This analysis gives us the ability to say, okay, this product (Intelligent Checking) is working. It's giving us a good income for the cost.
Working with Finance on a Loss Prevention Dashboard
Previously, It would take someone almost 8 hours to be able to produce a loss prevention report each time it was requested. The loss prevention dashboard that the iQ Credit Union team built allows them to easily analyze whether they are having the right recoveries. It shows the summary of all chargeoffs per month and offers the ability to easily filter to previous months to go back and see how loans are doing.
Once the foundation of this dashboard was built, the iQ team only needed to keep adding tracking records, greatly simplifying their process for retrieving this information.
Want to learn more about iQ Credit Union's data journey?