How Credit Unions & Banks Can Streamline Reporting Workflows
by Arkatechture, on August 23, 2019

Internal reporting has always been an essential component of banking operations. For decades, financial institutions have collected transactional data for compliance purposes. In the years following the 2008 financial disaster, these activities have only increased in importance as oversight bodies here and abroad have rolled out new regulatory measures meant to protect consumers and mitigate risk.
At the same time, business intelligence has transformed from a nice-to-have into an essential resource for financial institutions to maintain a competitive edge in an increasingly fintech dominated landscape. With transaction data being stored and analyzed for risk or compliance purposes, it makes sense to also leverage it for data analysis to inform future strategic business decisions.
However, many organizations struggle to handle this burden without outside help. In fact, 77% of banking executives cited meeting compliance and reporting standards as an essential business priority in 2018, analysts for EY discovered. This indicates that most financial institutions are still looking for ways to streamline and optimize their reporting activities.
Luckily, there is a solution. Implementing data management best practices and pushing reports with automated scheduling with data visualization tools such as Tableau or Power BI. This software supports streamlined reporting workflows & insights by focusing on these three key process improvements:
Increased Accuracy
Data visualization solutions connect directly to data sources or an analytical data warehouse to feed data into the reporting tool. This setup automates data preparation and reduces the need for manual data wrangling which increases data accuracy, according to researchers for Deloitte. In an ideal world, data quality cleanup efforts are also pushed back to the source system to continually improve data quality at the source. This drastically improves organizational planning and compliance efforts as stakeholders can base their decisions and reports off of data-driven insights.
Improved Clarity
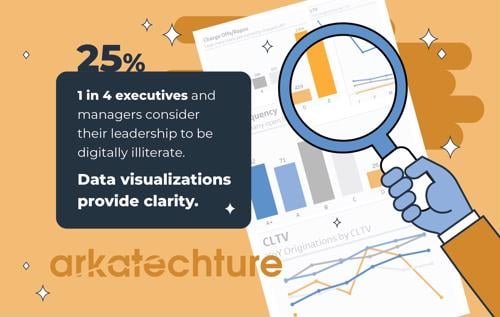
Despite the emergence and general acceptance of the need for data infrastructure, 1 in 4 executives and managers consider their company's leadership to be digitally illiterate. That means key decision makers may not be capable of parsing the information advanced business intelligence tools produce, an ISACA report revealed. This lack of data literacy creates serious problems for banks, whose leaders must understand how to interpret the data to make key business development decisions. Data visualizations directly address this issue by providing informational clarity in the form of easy-to-grasp interactive dashboards. Instead of navigating overstuffed spreadsheets, C-suite dwellers can click through engaging visualizations.
Streamlined Sharing
Risk culture and compliance go hand-in-hand, researchers for McKinsey found. When operational personnel know how to spot risk and have the tools needed to move potential problems up the chain of command, fewer mistakes are made, making it easier for any given bank to meet compliance standards. Data visualization tools support this sort of streamlined sharing, allowing staff to access potentially problematic reports and send them along to high-ranking decision-makers, who can mitigate their impact and reduce the likelihood of legal blowback.
Is your bank prepared to bolster its reporting workflows via cutting-edge data visualization tools? Connect with Arkatechture today. We help financial institutions of all sizes implement data visualization workflows meant to boost information accuracy and clarity, and facilitate sharing.
Contact us today to learn more about our solutions and services.


