


by Chris Bond, on November 8, 2016
My roommate and coworker Jared had just grabbed a load of stuff for our new apartment from his parents house. Included in this carload was every 90s kid's dream machine: a Nintendo 64, complete with the classics. Our personal favorite? Super Smash Bros 64. We immediately loaded in the cartridge and proceeded to play tons of games.
I began to tally up our wins on a chalkboard when Jared stopped me:
“We work for a data company, where’s the spreadsheet?”
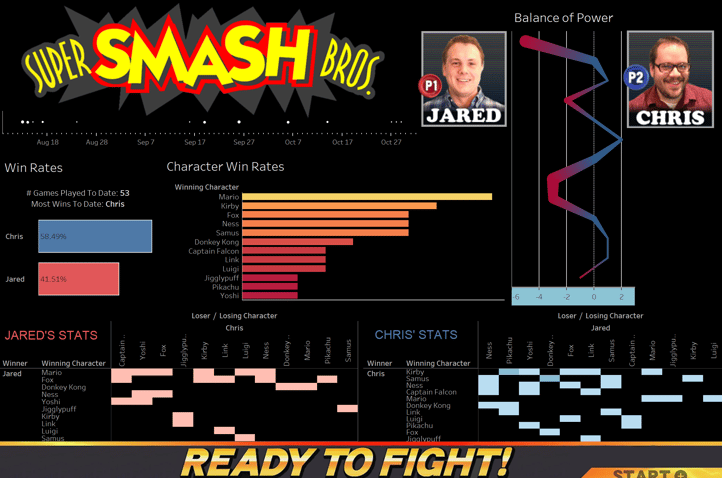
Fast forward three months, and we now have over 50 recorded games. Rules were seven lives each, random maps. We tracked which characters we chose, the date of the game, and who won - and things got pretty intense!
I gave our very own Katie Paige the Google Sheet we had been using to record our games, and she made a great viz in a just a couple of hours. I added a few graphics and touch ups but 90% of what’s below was her original creation. May I present the Smash Bros. Viz:
(Click to view the interactive viz)
In retrospect I wish we had gathered a little more data. How many lives were left over? Which map did we play on? How long did the match last? With each of these fun projects we learn something new - now we know what to keep track of next time we visualize Arkatechture game time!
We're using the new Google Sheets/Tableau Public capabilities for keeping data up to date on Tableau Public so stay tuned to see who wins next game!