


by Pat Lapomarda, on December 15, 2016
As another year comes to a close, it's customary to reflect on it. We launched Ask A Data Scientist, a monthly blog series in which we answer crowd-sourced Data Science questions, with the hopes of helping everyone and anyone understand Data Science a little bit better. In this post, we will be reviewing some of our 2016 AADS posts and the commonalities many of them share: Interpretability vs Accuracy and How To Assess a Model!
in May, our first post discussed 4 different statistical measures for 3 different models, and how to decide which is best:

June's follow-up answered a question about learning data science. July's topic was Algorithms vs. Data with a twist from the Data Quantity vs Data Quality debate, which has been a huge topic in the aftermath of all the failed predictions during the latest election cycle.

August's installment extended the Quality over Quantity concept by answering a Quora question "What are the things that Data Scientist have to spend time on that they'd rather not?" It highlighted that being a Data Scientist is actually being a Data Janitor, making sure data being processed is of high quality, because "Garbage-in/Garbage-out" is a very real issue in the field.
September's installment started a deep dive into Clustering in Tableau, which was followed up with an "under-the-hood" look at Clustering in R vs. Tableau in November:
|
|
||
|---|---|---|
| Distance Measurement |
Euclidean only |
Euclidean only, but with alternative implementation (kmeans {amap}) Maximum, Manhattan, Canberra, Binary, Pearson , Correlation, Spearman, & Kendall are also available |
| Centroid Initialization |
Uses the Howard-Harris method to divide the original data into 2 parts, then repeats on the part with the highest distance variance until k is reached. Bora Beran from Tableau does a great job explaining this. |
Randomly (using set.seed) or Deterministically (using centers) picks k points define the clusters |
| Categorical Variable Use |
Built in transformation using Multiple Correspondence Analysis (MCA) to convert the category to a distance. |
Separate function for categorical data (kmodes) using mode vs. mean as measure or requires pre-processing to convert categories into numbers. |
In between the deep-dive into Tableau 10 clustering, October's installment of AADS discussed Interpretability as a key driver of regression's ranking in the Top Algorithms Used by Data Scientists:
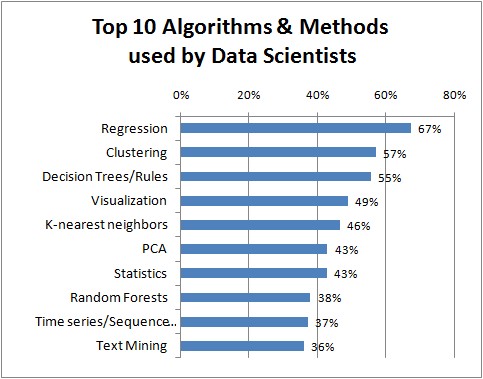
A recent blog post on KDNuggets, Interpretability over Accuracy, re-enforced this driver while highlighting the users of the model as a key consideration when developing a predictive approach.
While there are trade-offs in how to measure the statistical power of a model based upon it's use, the foundational elements of Data Quality and Interpretability are much more important considerations, since the statistical measures assume both high data integrity and faithful follow-through on the model's output. Therefore, when planning a predictive solution, starting & ending with the user of the model and taking time to understand the critical aspects of how & why the solution is needed are paramount. This will be an area of elaboration in 2017, so if you have any questions about this, please:
