Tableau Vs. D3
by Katie Paige, on October 13, 2016
As the data visualization industry grows, more visualization tools are popping up, filling certain niches. While Tableau has long been the standout leader in the industry (and our personal favorite), Microsoft Power BI, D3, and Birst are gaining some traction. We’ve been testing out these new tools, and this week, we decided to take a look at Tableau vs D3.
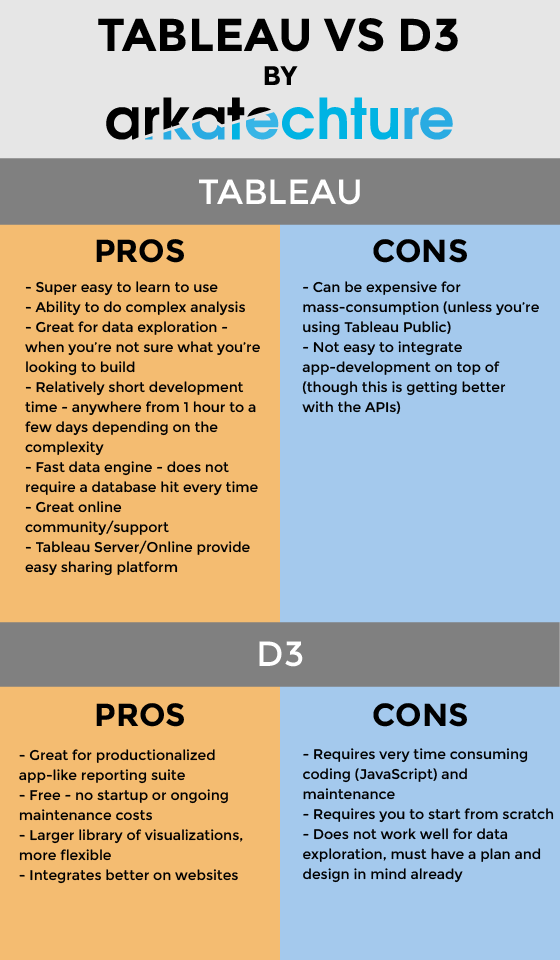
Let’s take a look at the pros and cons of each:

Ultimately, we’ve found that Tableau and D3 are two similar tools that serve very different purposes.
Tableau’s mission has been to create a tool that can be used by anyone to explore their data and find valuable patterns and insights - and they’ve been able to do just that. Tableau is easy to use, and has a great community and support team to help answer any questions you might have. This means that Tableau is a great tool for anybody to use - you don’t have to be a developer or an artist to create powerful, compelling, beautiful visualizations. This ease of use and scalability comes at a cost - software fees.
That’s where D3 comes in - it’s free! As enticing as this is, it takes a significantly greater investment in time and development hours than Tableau. If you have both these things readily available, then D3 brings great benefits, such as fast and exceptional visualizations, and flawless integration into websites. If you haven’t checked out the D3 library already, it’s worth a look.
Tableau's strengths are D3's shortcomings, and inversely, D3 shines where Tableau does not. It's easy to see that Tableau was built for the BA, and D3 was built for the developer. However - that doesn't mean the two tools are mutually exclusive! We’ve seen and heard of some success stories with BAs using Tableau to explore and prototype their data visualizations, and then recreating those charts in D3 to create websites with an app-like reporting suite. This is a great way to combine the strengths of both tools and achieve great results.


