Office Intelligence: Coffee Production
by Chris Bond, on April 28, 2016

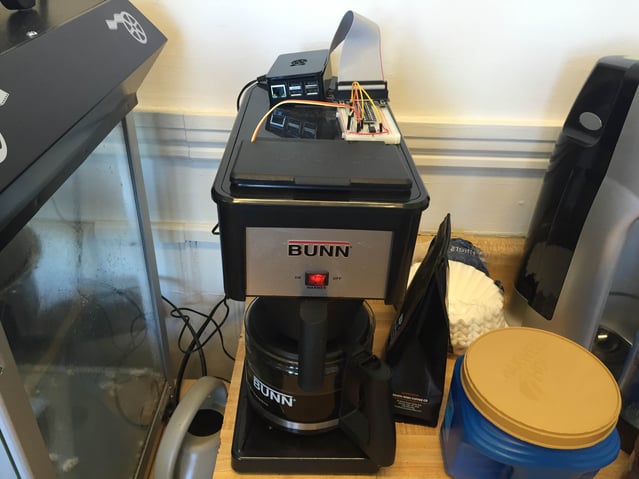
As part of our new series, Office Intelligence, we will be developing ways to automatically collect data around the Arkatechture offices! We used one of our office Raspberry Pis, our internal database (called "ArkaBase"), and our collective data programming expertise. With work done for the day and pizza ordered, we tackled the first thing on our list: our in-house coffee production!
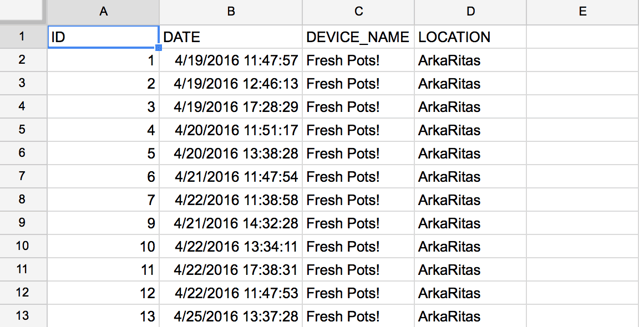
We broke into two teams, and first team started by creating the backend using Amazon Web Services' Lambda and API Gateway. This listens to our Pi whenever it is activated, and sends a message to our database, like so:

Meanwhile, the second team began working on hooking up a photoresistor that indicates when the coffee maker was in use and being replenished. If the light detector comes into contact with a light for at least 10 seconds that counts as a reading. We chose a 10 second lag in order to account for false positives. We figured out how to turn the readings from the sensor into messages, and tied it all together with a Python script. It took some time to get everything set up just right, but once we got it all working together, it was well worth it!

After having the setup live for a little over a week, a couple of our Vizzers worked to make a dashboard using the data we collected!


