


by Hannah Barrett, on June 29, 2022
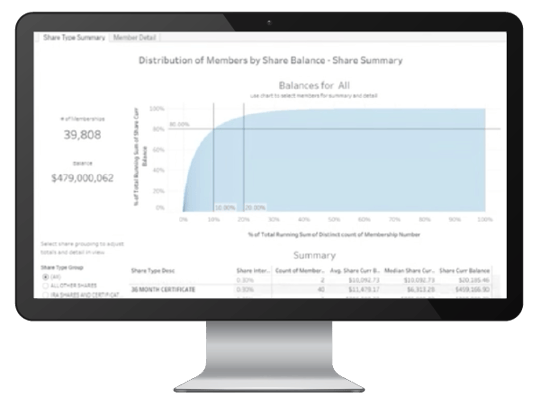
"How many members control 80% or more of our overall share balance?"
"Should we adjust our messaging to those members?
These were the questions Heritage Financial Credit Union's retail team faced amidst the largest increase of the Federal Reserve's key interest rate in 28 years. They quickly understood the impacts this might have on share deposits for any members that might start rate shopping in the near future.
It's important for credit unions to have a thorough understanding of their membership base. One way to do this is to break down a select population into 10% increments also called deciles. A good rule of thumb to follow is the Pareto principle which outlines an 80/20 rule. In this scenario, this means 20% of members should hold roughly 80% of balances.
If, for example, 3% of the credit union's members hold 80% of share deposits, then the business might have a higher risk if one or a few of those members move their deposits elsewhere to get a better interest rate. If you know this in advance, action can be taken after analyzing the data to engage with those members.
Heritage Financial Credit Union, located in New York and serving 42,000 members, recently built a 'Distribution of Members by Share Balance' dashboard using their Arkalytics sandbox and Tableau. With this dashboard, they are able to segment, visualize, and track which members control X percentage of deposits.
Using this information, Heritage Financial Credit Union can act accordingly when deciding how and when to communicate with members. If members are in that top 20%, they may want to consider personalizing their communication with those members a bit more, for example. This personalization is one of the main factors that makes credit unions stand out from big banks.
The Impact and Results
In the past, putting together this data for analysis would have taken a few weeks to do manually, versus now it’s streamlined and available any time they need it.
Previously, they would perform this exercise once a year or so, and now their dashboard serves up the same information updated with the latest data each and every day. This enables Heritage Financial Credit Union to operate proactively, as opposed to looking at balances one month and comparing them to the next just to see that balances dropped off and that nothing was done about it.
Now that Heritage Financial Credit Union is leveraging Arkalytics, they are able to perform quick analysis of underlying data which keeps them agile in a rapidly changing environment. Rather than having something static and cumbersome, they now have a dynamic solution that automatically updates data every morning. Senior management became engaged with the dashboards, and as far as analytics and understanding their data, it has increased the maturity of this department.
We enjoy working with Arkatechture, we love it." - Alejandro Perez, Business Intelligence Data Analyst at HFCU
Want to see more? Check out the full case study below!
